Port of seaborn.barplot. Bar heights are an aggregate (default mean) with a
bootstrap CI error bar. Returns a reaborn_plot.
Usage
barplot(
  data = NULL,
  x = NULL,
  y = NULL,
  hue = NULL,
  order = NULL,
  hue_order = NULL,
  estimator = "mean",
  errorbar = list("ci", 95),
  n_boot = 1000,
  seed = NULL,
  units = NULL,
  weights = NULL,
  orient = NULL,
  color = NULL,
  palette = NULL,
  saturation = 0.75,
  fill = TRUE,
  width = 0.8,
  dodge = "auto",
  gap = 0,
  capsize = 0,
  err_kws = NULL,
  legend = "auto",
  .facet_vars = NULL,
  ...
)
Arguments
- data
A data frame.
- x, y
Variables; the categorical one defines the groups.
- hue
Grouping variable for color (dodged).
- order, hue_order
Level orderings.
- estimator, errorbar, n_boot, seed
Aggregation + error settings.
- units, weights
Bootstrap structure / weights (units reserved).
- orient
"v","h", orNULLto infer.- color, palette, saturation, fill
Color controls (saturation default 0.75).
- width, gap
Box width and gap between dodged boxes.
- dodge
How to dodge bars by hue (
"auto",TRUE, orFALSE).- capsize
Width of the error bar caps.
- err_kws
Passed to the error bar geom.
- legend
Legend control.
- .facet_vars
Internal; facet columns forwarded by the figure-level dispatchers (catplot/displot/relplot). Not intended for direct use.
- ...
Passed to the bar geom.
Examples
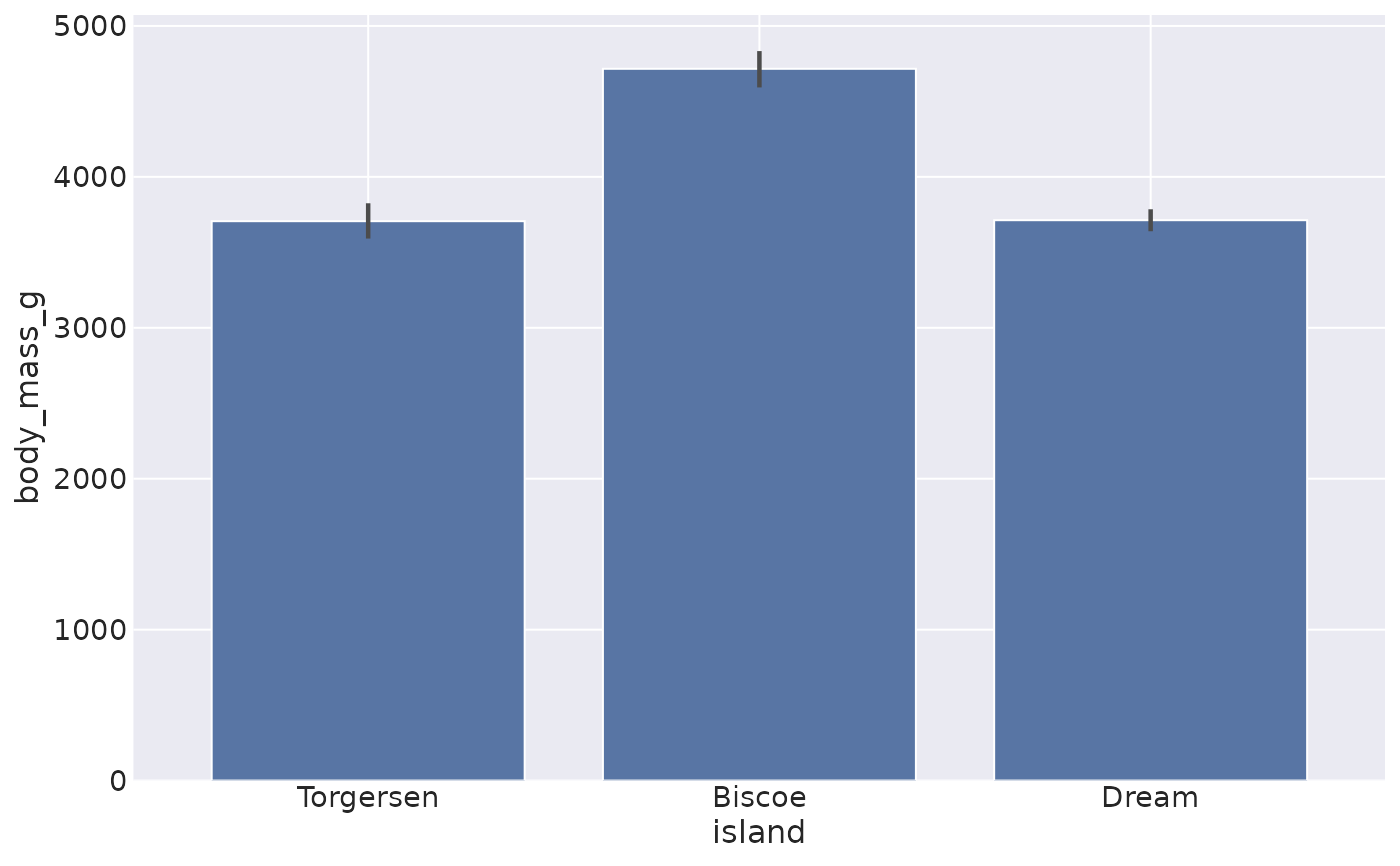
penguins <- load_dataset("penguins")
barplot(data = penguins, x = "island", y = "body_mass_g")
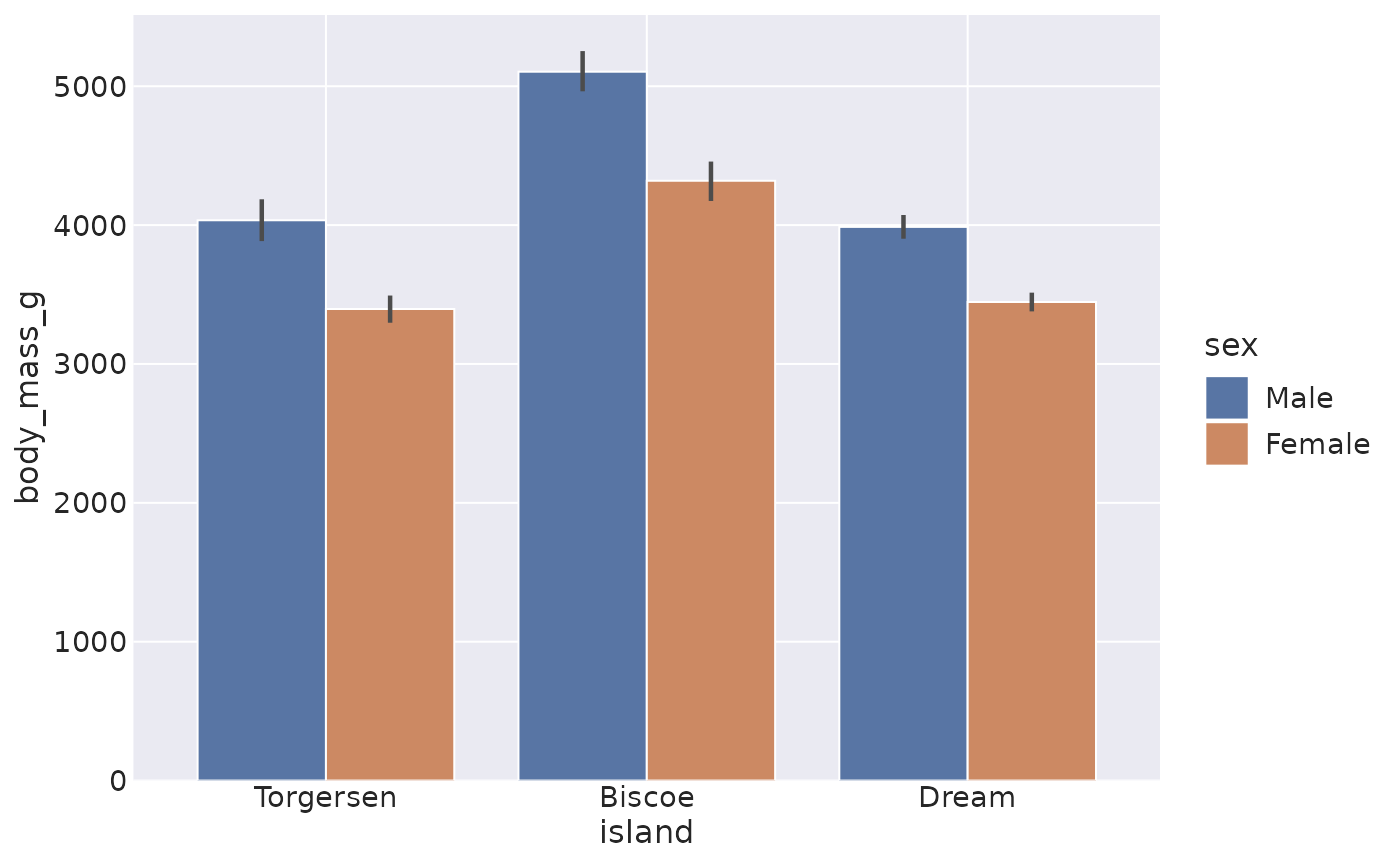
 barplot(data = penguins, x = "island", y = "body_mass_g", hue = "sex")