Port of seaborn.countplot. Returns a reaborn_plot.
Usage
countplot(
  data = NULL,
  x = NULL,
  y = NULL,
  hue = NULL,
  order = NULL,
  hue_order = NULL,
  orient = NULL,
  color = NULL,
  palette = NULL,
  saturation = 0.75,
  fill = TRUE,
  stat = "count",
  width = 0.8,
  dodge = "auto",
  gap = 0,
  legend = "auto",
  .facet_vars = NULL,
  ...
)
Arguments
- data
A data frame.
- x, y
Variables; the categorical one defines the groups.
- hue
Grouping variable for color (dodged).
- order, hue_order
Level orderings.
- orient
"v","h", orNULLto infer.- color, palette, saturation, fill
Color controls (saturation default 0.75).
- stat
"count","percent","proportion", or"probability".- width, gap
Box width and gap between dodged boxes.
- dodge
How to dodge bars by hue (
"auto",TRUE, orFALSE).- legend
Legend control.
- .facet_vars
Internal; facet columns forwarded by the figure-level dispatchers (catplot/displot/relplot). Not intended for direct use.
- ...
Passed to the bar geom.
Examples
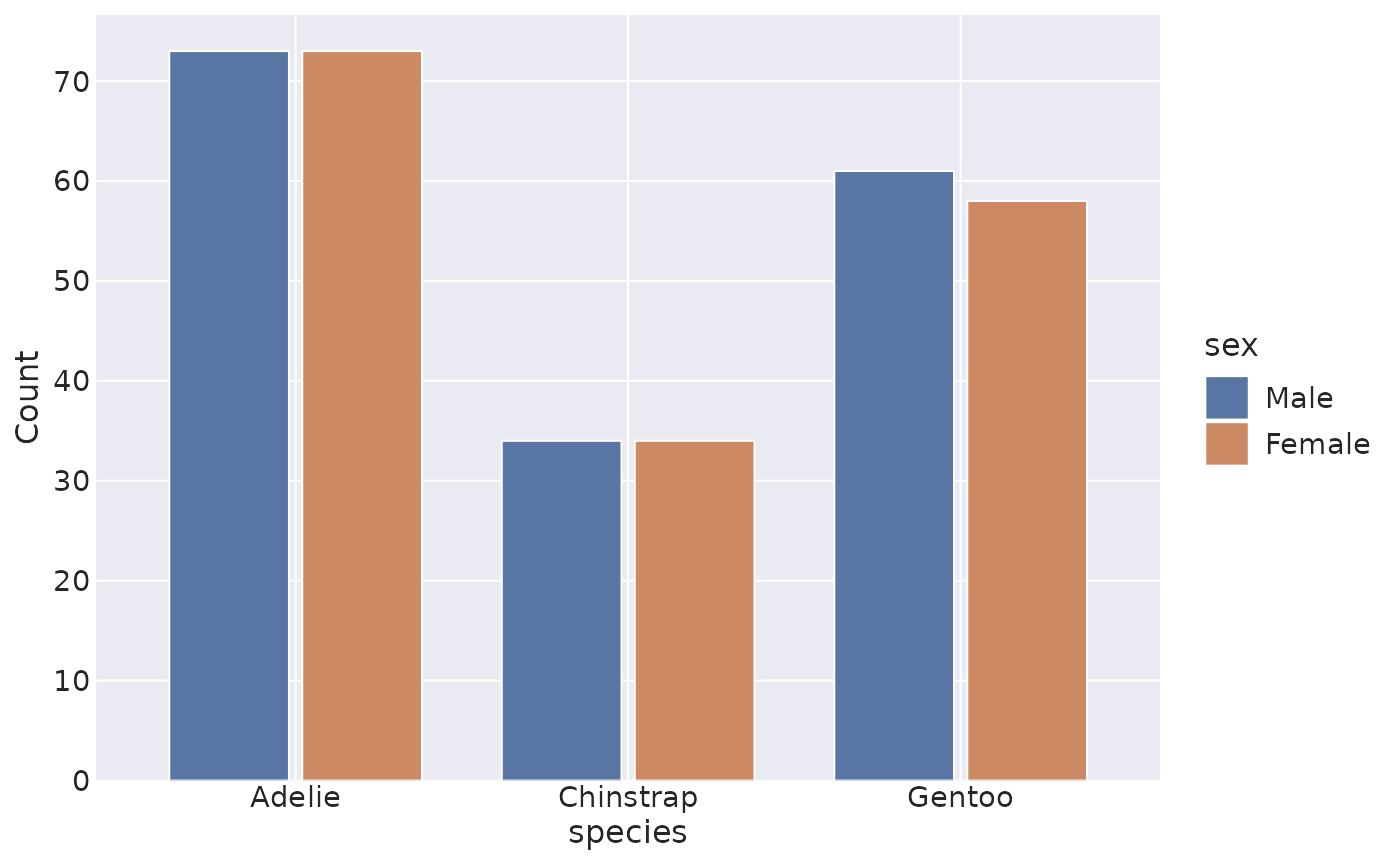
penguins <- load_dataset("penguins")
countplot(data = penguins, x = "species", hue = "sex")
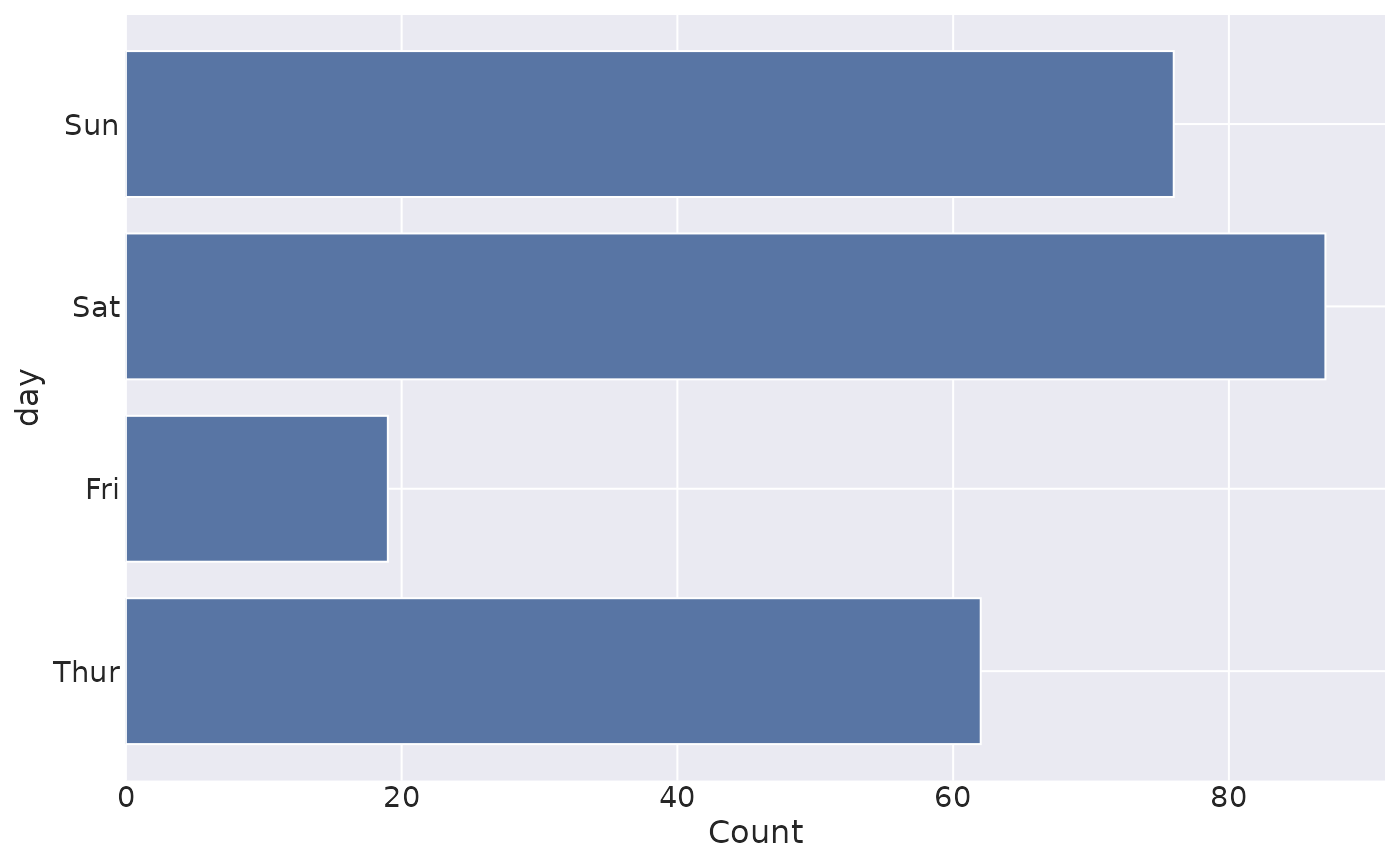
 # Horizontal bars by assigning the categorical variable to y.
tips <- load_dataset("tips")
countplot(data = tips, y = "day")
# Horizontal bars by assigning the categorical variable to y.
tips <- load_dataset("tips")
countplot(data = tips, y = "day")