Port of seaborn.heatmap. Returns a reaborn_plot.
Usage
heatmap(
  data,
  vmin = NULL,
  vmax = NULL,
  cmap = NULL,
  center = NULL,
  robust = FALSE,
  annot = NULL,
  fmt = ".2g",
  annot_kws = NULL,
  linewidths = 0,
  linecolor = "white",
  cbar = TRUE,
  square = FALSE,
  xticklabels = "auto",
  yticklabels = "auto",
  mask = NULL,
  ...
)
Arguments
- data
A matrix or data frame of values.
- vmin, vmax
Color scale limits.
- cmap
A colormap name (default
"rocket", or"icefire"withcenter).- center
Value at which to center a diverging colormap.
- robust
Use the 2nd/98th percentiles for the color limits.
- annot
Annotate each cell with its value (
TRUE) or a matrix of labels.- fmt
Number format for annotations (default
".2g").- annot_kws
Passed to the text geom.
- linewidths, linecolor
Cell border width and color.
- cbar
Show the color bar.
- square
Force square cells.
- xticklabels, yticklabels
Tick label control (
"auto",TRUE/FALSE).- mask
Logical matrix of cells to hide.
- ...
Reserved.
Examples
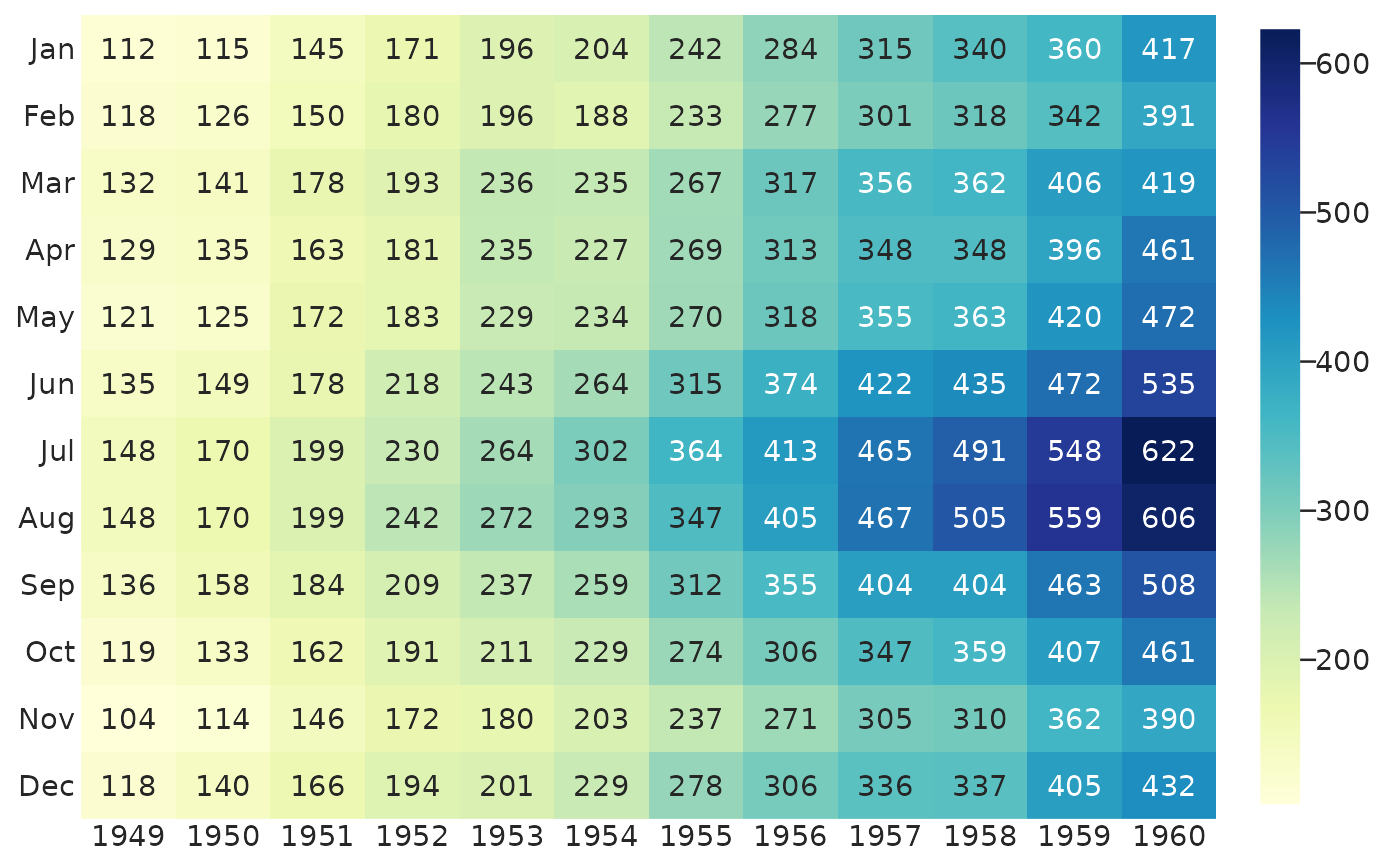
flights <- load_dataset("flights")
m <- tapply(flights$passengers, list(flights$month, flights$year), sum)
heatmap(m, annot = TRUE, fmt = "d", cmap = "YlGnBu")
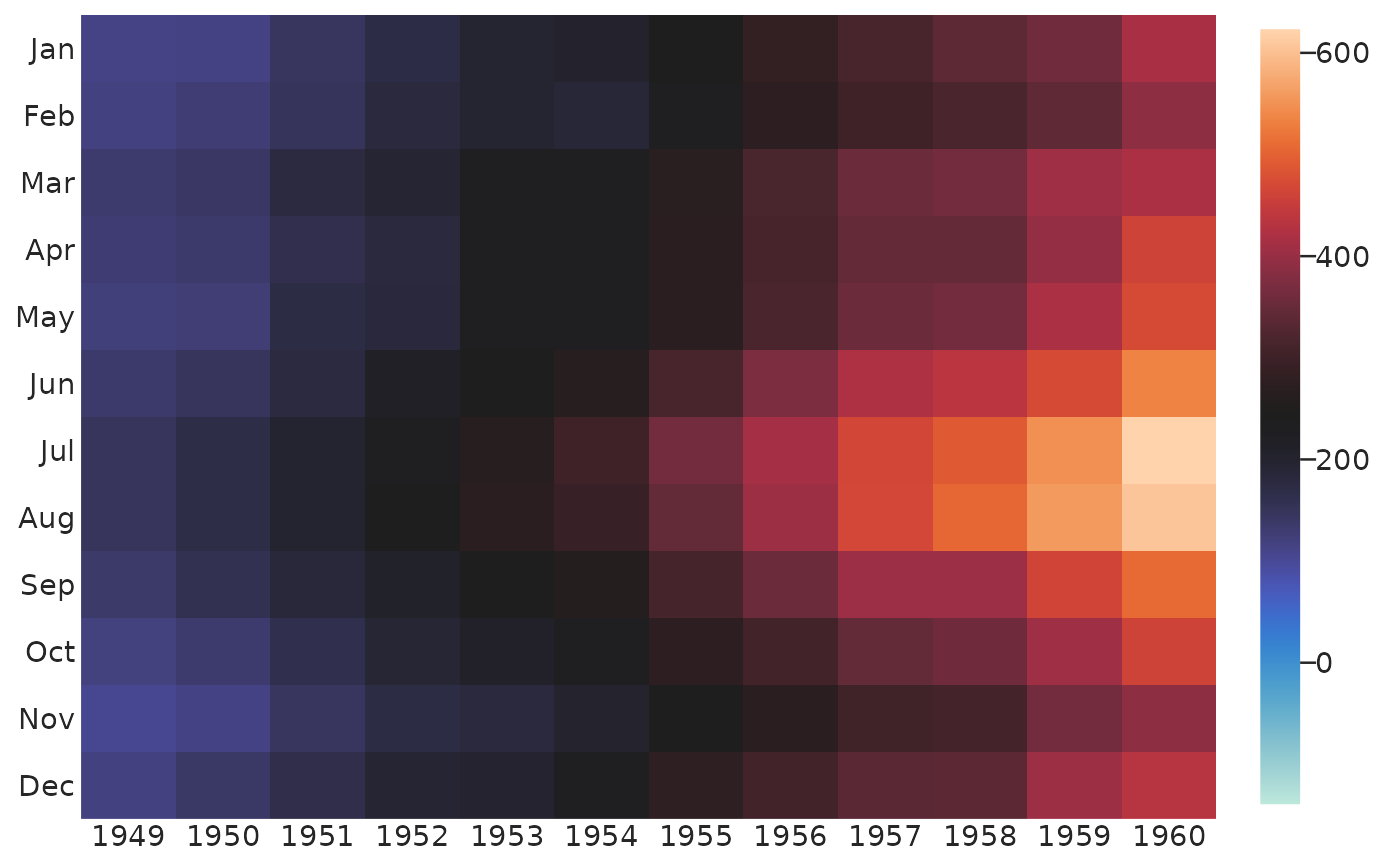
 # Center a diverging colormap on a reference value
heatmap(m, center = m["Jan", "1955"], cmap = "icefire")
# Center a diverging colormap on a reference value
heatmap(m, center = m["Jan", "1955"], cmap = "icefire")