Port of seaborn.histplot. Returns a reaborn_plot.
Usage
histplot(
  data = NULL,
  x = NULL,
  y = NULL,
  hue = NULL,
  weights = NULL,
  stat = "count",
  bins = "auto",
  binwidth = NULL,
  binrange = NULL,
  discrete = NULL,
  cumulative = FALSE,
  common_bins = TRUE,
  common_norm = TRUE,
  multiple = "layer",
  element = "bars",
  fill = TRUE,
  shrink = 1,
  kde = FALSE,
  kde_kws = NULL,
  thresh = 0,
  cbar = FALSE,
  cbar_kws = NULL,
  palette = NULL,
  hue_order = NULL,
  hue_norm = NULL,
  color = NULL,
  cmap = NULL,
  legend = TRUE,
  .facet_vars = NULL,
  ...
)
Arguments
- data
A data frame.
- x, y
Column name/vector for the histogram variable (use
yfor a horizontal histogram).- hue
Grouping variable for color.
- weights
Optional observation weights.
- stat
One of
"count","frequency","density","probability","proportion","percent".- bins, binwidth, binrange, discrete
Binning controls (see rb_hist_bins).
- cumulative
Accumulate counts.
- common_bins, common_norm
Share bins/normalization across hue groups.
- multiple
"layer","stack","fill", or"dodge".- element
"bars"or"step".- fill
Whether to fill the bars.
- shrink
Shrink bar widths by this factor.
- kde
Overlay a KDE curve.
- kde_kws
Arguments for the KDE (e.g.
bw_adjust).- thresh
Bivariate-only. Cells with a value at or below
threshare left transparent (default0, so empty cells are blank);NULLfills every cell.- cbar, cbar_kws
Bivariate-only. Draw a color bar for the counts;
cbar_kwsacceptswidth(the bar width in points).- palette, hue_order, hue_norm, color
Color controls.
- cmap
Bivariate-only colormap (name,
reaborn_cmap, or color vector); defaults to a light sequential ramp built fromcolor.- legend
Show the legend.
- .facet_vars
Internal; facet columns forwarded by the figure-level dispatchers (catplot/displot/relplot). Not intended for direct use.
- ...
Passed to the bar geom.
Details
When both x and y are supplied, histplot() draws a single 2-D count
heatmap (like seaborn.histplot(x, y)). In that bivariate case hue is
ignored, with a warning, and the hue-based color controls (palette,
hue_order, hue_norm) do not apply; the fill is driven by cmap, which
defaults to a light sequential ramp built from color.
Examples
penguins <- load_dataset("penguins")
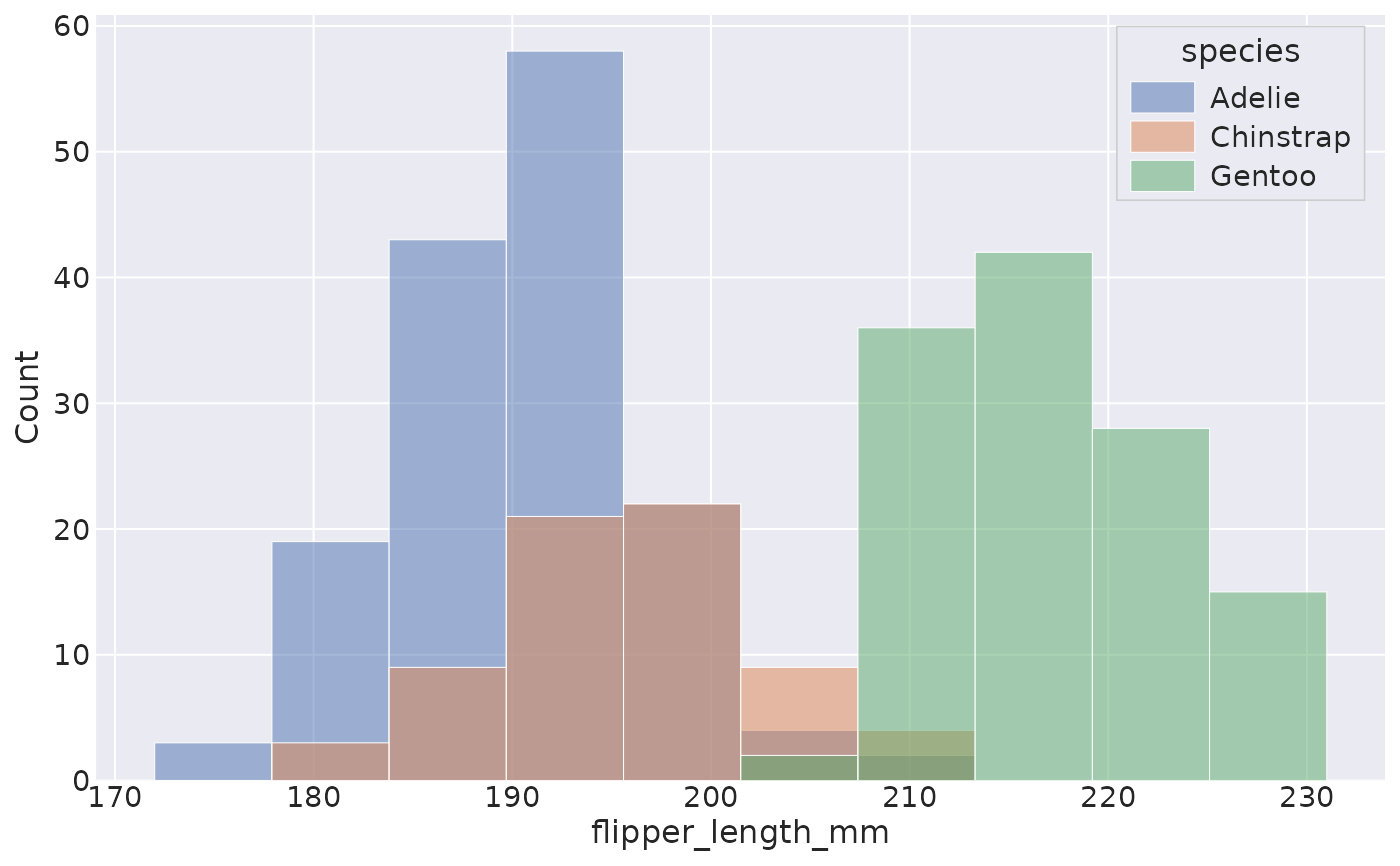
histplot(data = penguins, x = "flipper_length_mm", hue = "species")
 # Stack the hue groups
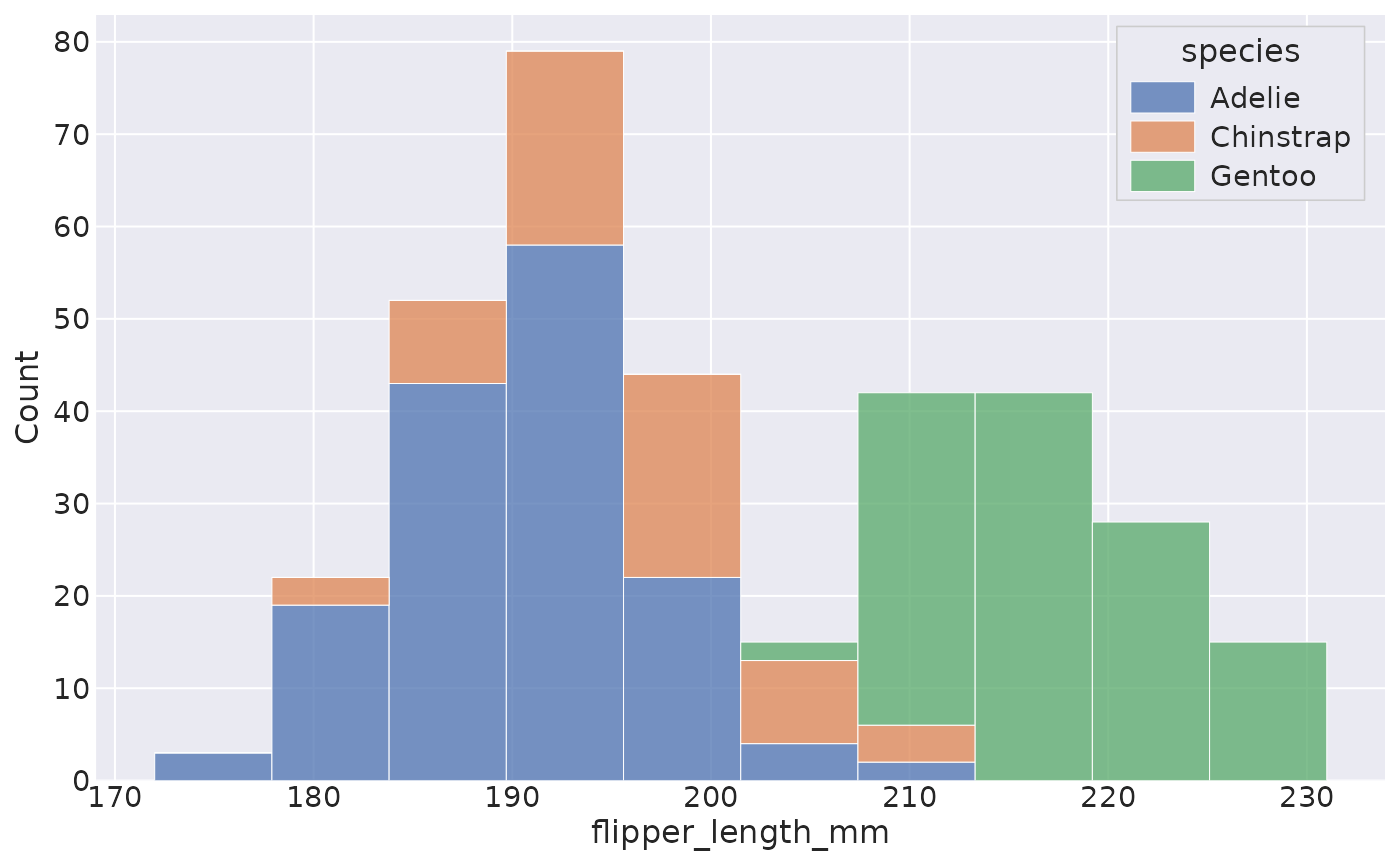
histplot(data = penguins, x = "flipper_length_mm", hue = "species", multiple = "stack")
# Stack the hue groups
histplot(data = penguins, x = "flipper_length_mm", hue = "species", multiple = "stack")