Port of seaborn.jointplot. Returns a patchwork composition (printable and
saveable like any reaborn plot).
Usage
jointplot(
  data = NULL,
  x = NULL,
  y = NULL,
  hue = NULL,
  kind = "scatter",
  height = 6,
  ratio = 5,
  space = 0.2,
  color = NULL,
  palette = NULL,
  ...
)
Arguments
- data
A data frame.
- x, y
Variables.
- hue
Grouping variable for color.
- kind
"scatter","kde","reg","hist", or"hex".- height
Figure size in inches (stored as an attribute).
- ratio
Joint-axes-to-marginal size ratio.
- space
Spacing between joint and marginal axes.
- color, palette
Color controls.
- ...
Passed to the joint plotting function.
Examples
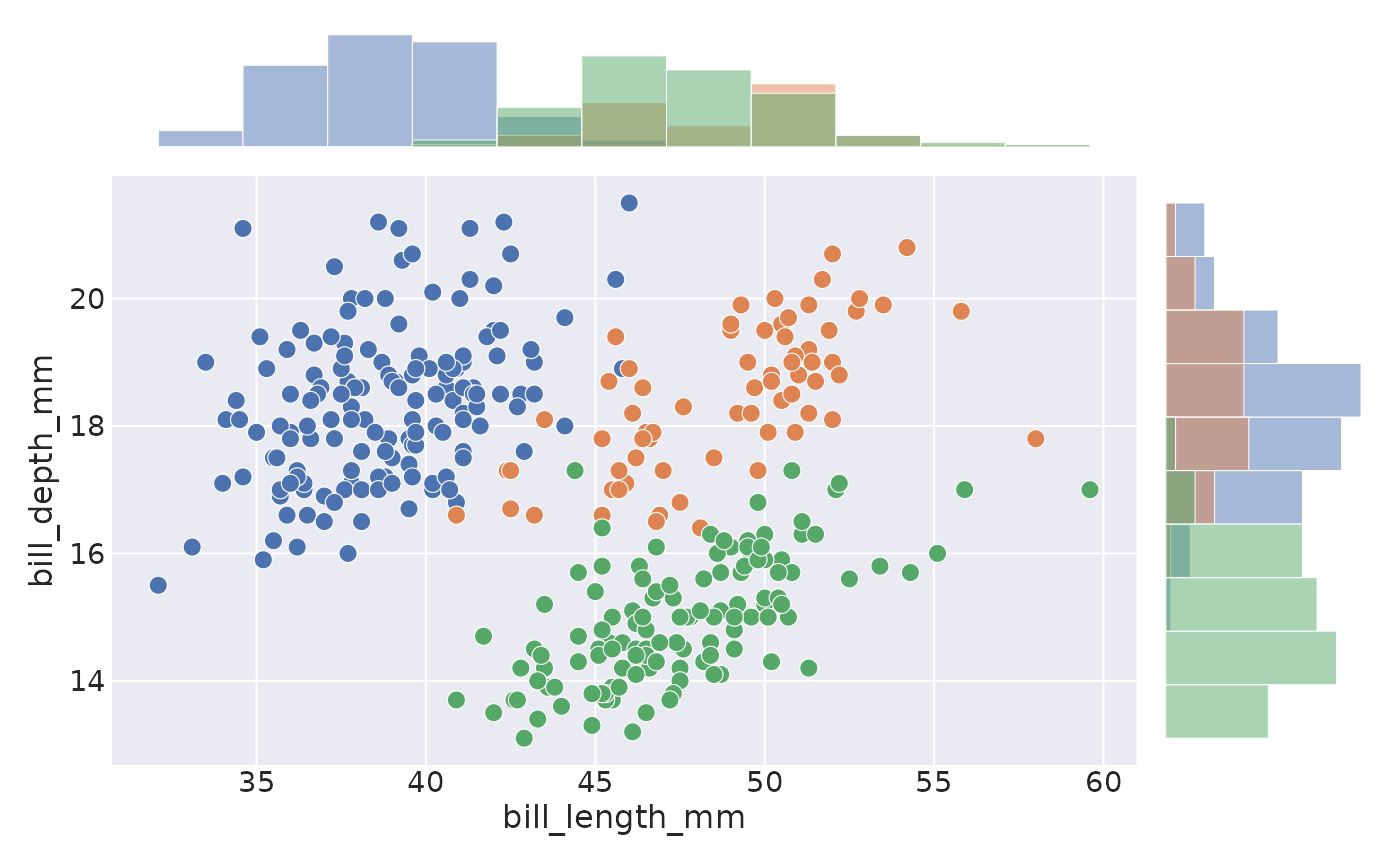
penguins <- load_dataset("penguins")
jointplot(data = penguins, x = "bill_length_mm", y = "bill_depth_mm", hue = "species")
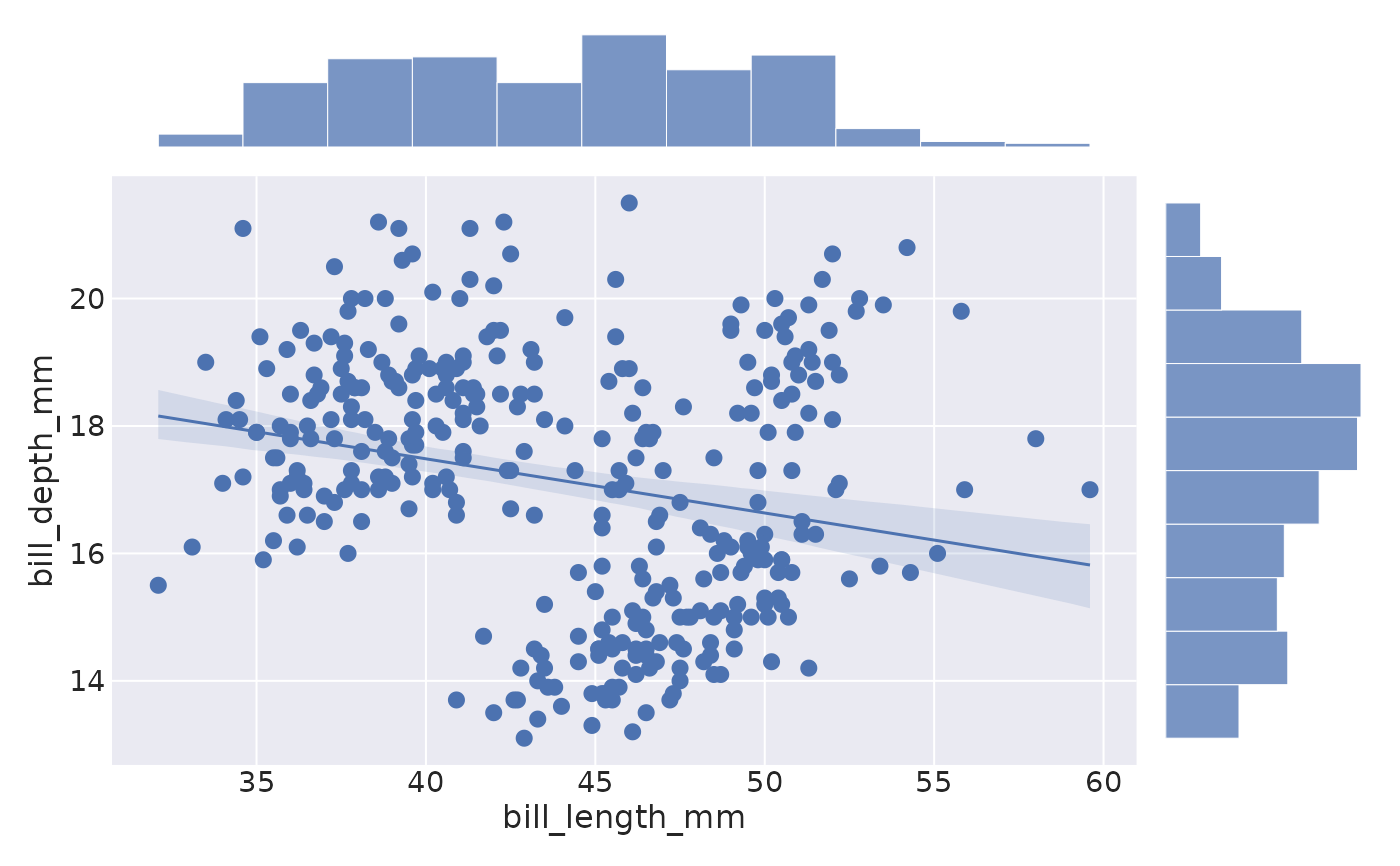
 jointplot(data = penguins, x = "bill_length_mm", y = "bill_depth_mm", kind = "reg")