Port of seaborn.kdeplot. The KDE matches scipy.stats.gaussian_kde exactly.
Returns a reaborn_plot.
Usage
kdeplot(
  data = NULL,
  x = NULL,
  y = NULL,
  hue = NULL,
  weights = NULL,
  palette = NULL,
  hue_order = NULL,
  hue_norm = NULL,
  color = NULL,
  fill = NULL,
  multiple = "layer",
  common_norm = TRUE,
  common_grid = FALSE,
  cumulative = FALSE,
  bw_method = "scott",
  bw_adjust = 1,
  log_scale = NULL,
  levels = 10,
  thresh = 0.05,
  gridsize = 200,
  cut = 3,
  clip = NULL,
  legend = TRUE,
  .facet_vars = NULL,
  ...
)
Arguments
- data
A data frame.
- x, y
Column name/vector for the histogram variable (use
yfor a horizontal histogram).- hue
Grouping variable for color.
- weights
Optional observation weights.
- palette, hue_order, hue_norm, color
Color controls.
- fill
Fill under the density curve (default
FALSE).- multiple
"layer","stack", or"fill".- common_norm, common_grid
Share normalization / evaluation grid across hue groups.
- cumulative
Plot the cumulative distribution.
- bw_method, bw_adjust
Bandwidth controls (scipy-compatible).
- log_scale
Reserved for compatibility.
- levels, thresh
Bivariate contour levels and density threshold.
- gridsize, cut, clip
KDE grid controls.
- legend
Show the legend.
- .facet_vars
Internal; facet columns forwarded by the figure-level dispatchers (catplot/displot/relplot). Not intended for direct use.
- ...
Passed to the bar geom.
Examples
penguins <- load_dataset("penguins")
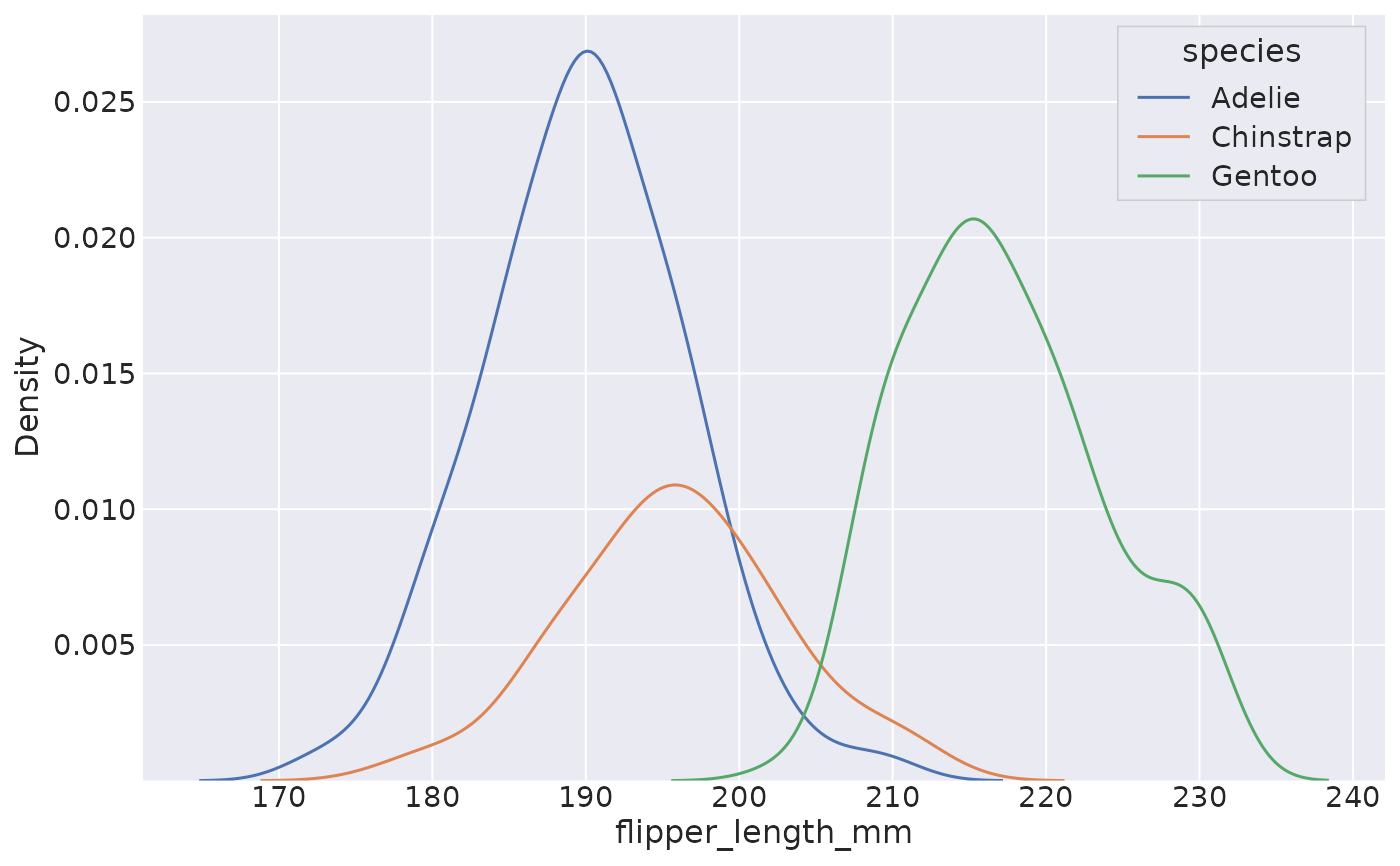
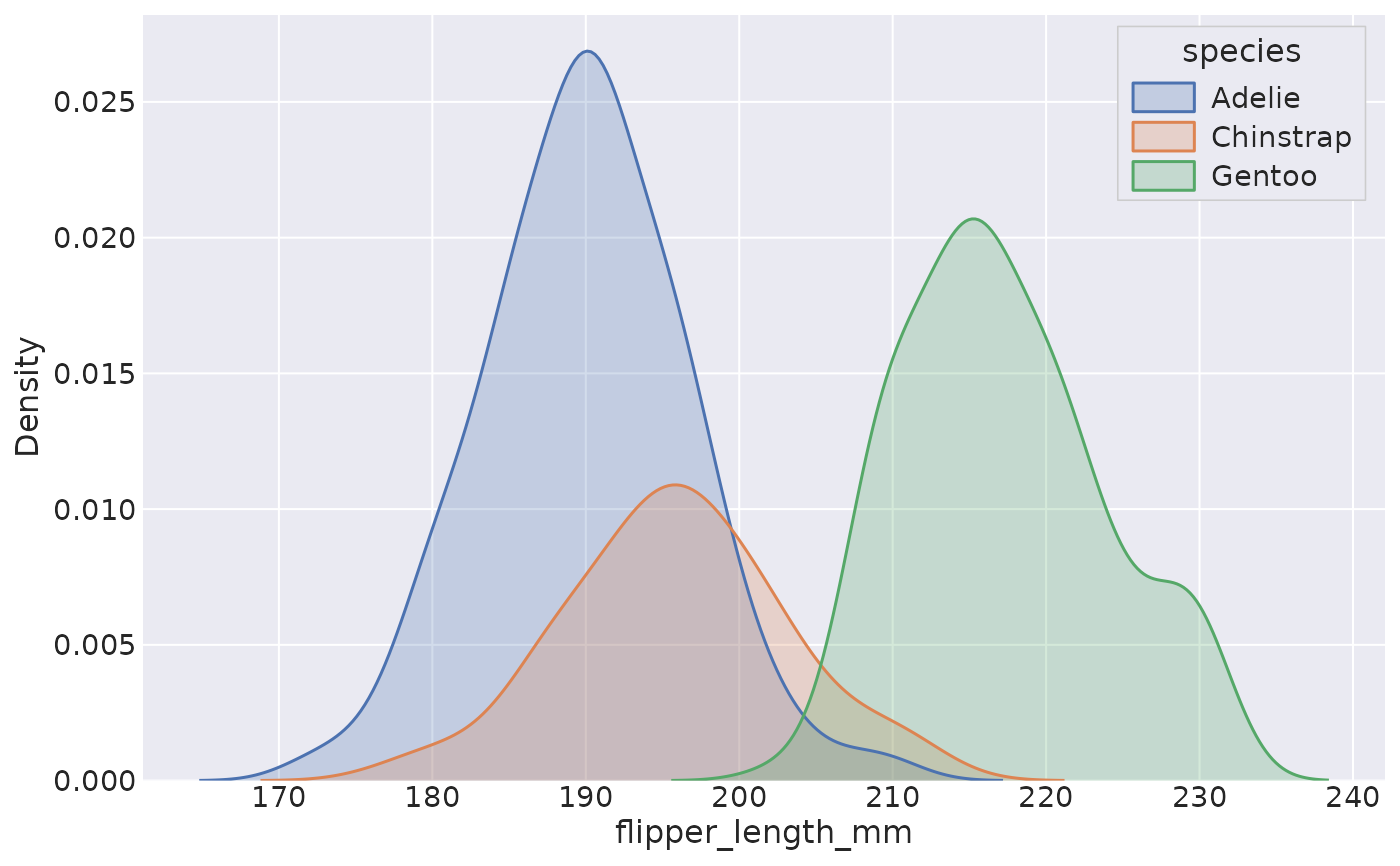
kdeplot(data = penguins, x = "flipper_length_mm", hue = "species", fill = TRUE)
 kdeplot(data = penguins, x = "flipper_length_mm", hue = "species", multiple = "stack")