Port of seaborn.lineplot. When the data has repeated observations per x
value, they are aggregated (default: mean) and an error band (default: 95%
bootstrap CI) is drawn. Returns a reaborn_plot.
Usage
lineplot(
  data = NULL,
  x = NULL,
  y = NULL,
  hue = NULL,
  size = NULL,
  style = NULL,
  units = NULL,
  weights = NULL,
  palette = NULL,
  hue_order = NULL,
  hue_norm = NULL,
  sizes = NULL,
  size_order = NULL,
  size_norm = NULL,
  dashes = TRUE,
  markers = NULL,
  style_order = NULL,
  estimator = "mean",
  errorbar = list("ci", 95),
  n_boot = 1000,
  seed = NULL,
  orient = "x",
  sort = TRUE,
  err_style = "band",
  err_kws = NULL,
  legend = "auto",
  .facet_vars = NULL,
  ...
)
Arguments
- data
A data frame.
- x, y
Column names (strings) or vectors giving the axes.
- hue, size, style
Column names/vectors for color, size, and marker-style semantics.
- units, weights
Column names/vectors for the unit grouping and weights.
- palette, hue_order, hue_norm
Control the color mapping.
- sizes, size_order, size_norm
Control the size mapping.
- dashes, markers
Style mapping controls.
- style_order
Order of style levels.
- estimator
Aggregation function name or callable (default
"mean";NULLto plot all observations).- errorbar
Error representation: a method name or
list(method, level)(defaultlist("ci", 95)).- n_boot, seed
Bootstrap settings for
errorbar = "ci".- orient, sort, err_style, err_kws
See seaborn.
- legend
"auto","brief","full", orFALSE.- .facet_vars
Internal; facet columns forwarded by the figure-level dispatchers (catplot/displot/relplot). Not intended for direct use.
- ...
Passed to ggplot2::geom_line.
Examples
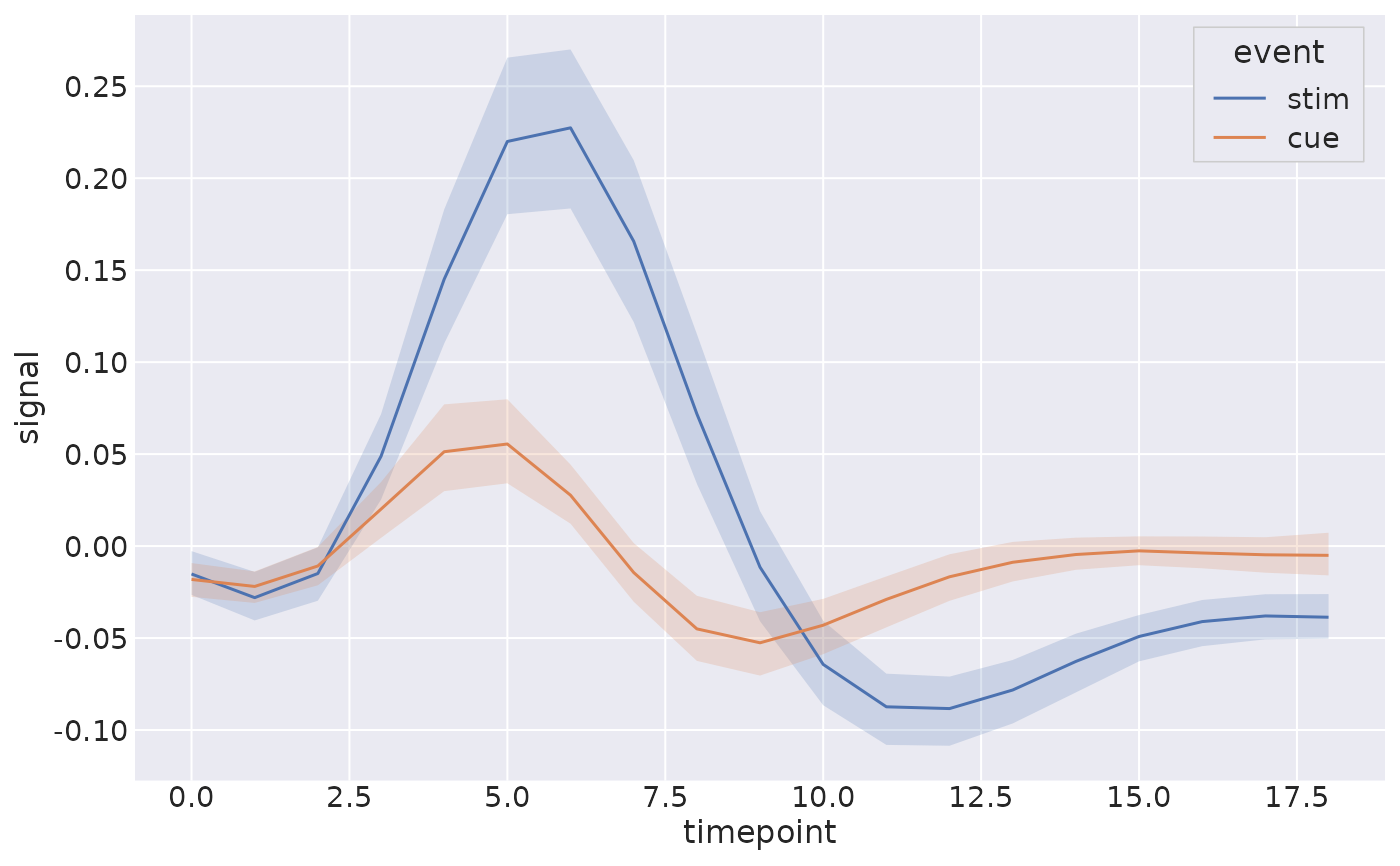
fmri <- load_dataset("fmri")
# Aggregated mean with a 95% bootstrap CI band across repeated observations
lineplot(data = fmri, x = "timepoint", y = "signal", hue = "event")
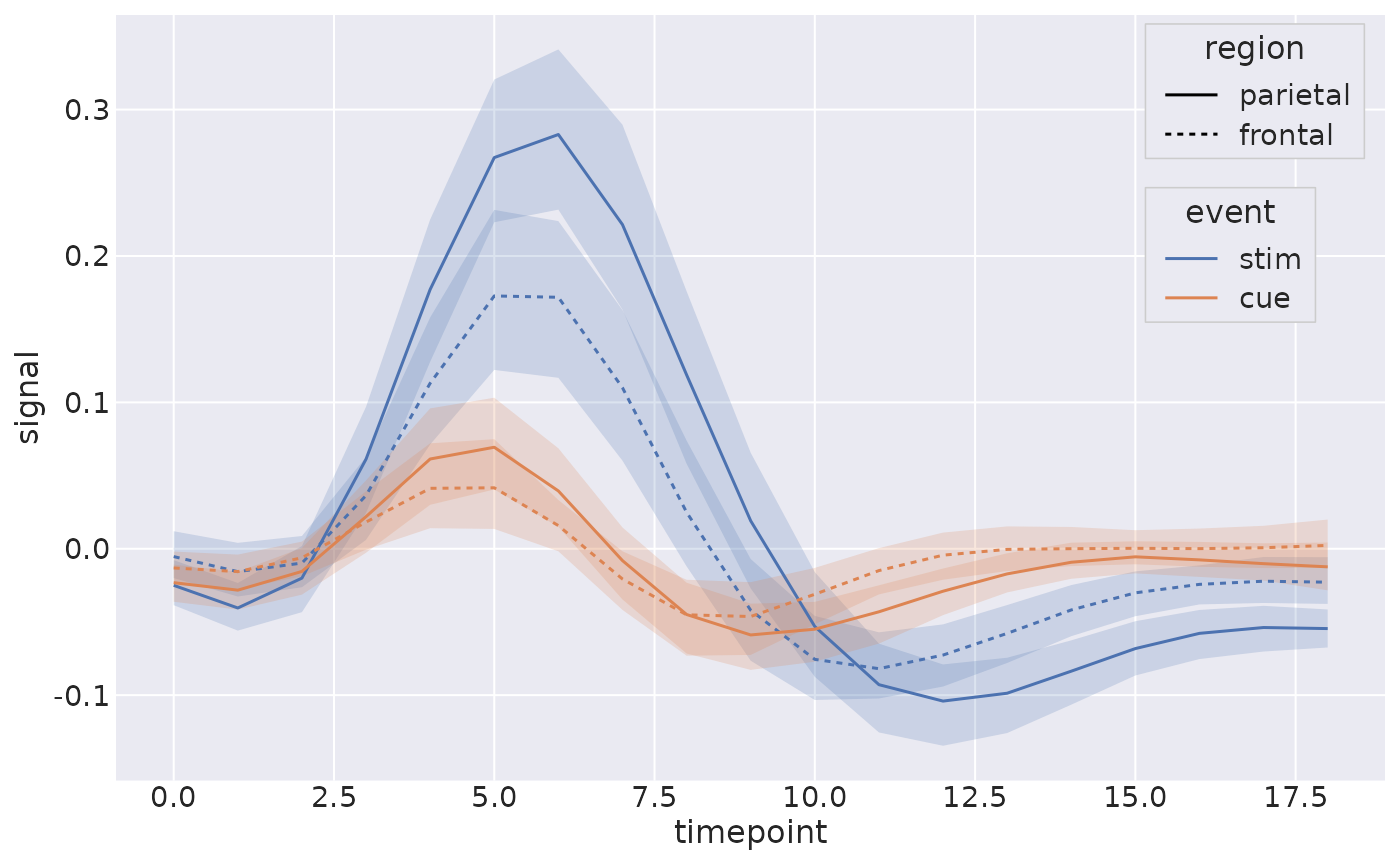
 # Add a style semantic to distinguish brain regions
lineplot(
data = fmri, x = "timepoint", y = "signal",
hue = "event", style = "region"
)
# Add a style semantic to distinguish brain regions
lineplot(
data = fmri, x = "timepoint", y = "signal",
hue = "event", style = "region"
)