Port of seaborn.lmplot. Draws regplot across a grid of facets and/or hue
groups. Returns a reaborn_plot.
Usage
lmplot(
  data = NULL,
  x = NULL,
  y = NULL,
  hue = NULL,
  col = NULL,
  row = NULL,
  palette = NULL,
  col_wrap = NULL,
  height = 5,
  aspect = 1,
  order = 1,
  logistic = FALSE,
  lowess = FALSE,
  robust = FALSE,
  logx = FALSE,
  ci = 95,
  n_boot = 1000,
  seed = NULL,
  scatter = TRUE,
  fit_reg = TRUE,
  hue_order = NULL,
  row_order = NULL,
  col_order = NULL,
  legend = TRUE,
  facet_kws = NULL,
  ...
)
Arguments
- data
A data frame.
- x, y
Variables.
- hue, col, row
Semantic / faceting variables.
- palette
Hue palette.
- col_wrap, row_order, col_order, hue_order
Ordering / wrapping.
- height, aspect
Facet sizing.
- order
Polynomial order for the fit (default 1, linear).
- logistic, lowess, robust, logx
Alternative fits.
- ci
Confidence-band width (default 95;
NULLto omit).- n_boot, seed
Bootstrap settings.
- scatter, fit_reg
Whether to draw the scatter / the fit.
- legend, facet_kws
Legend / facet options.
- ...
Reserved.
Examples
tips <- load_dataset("tips")
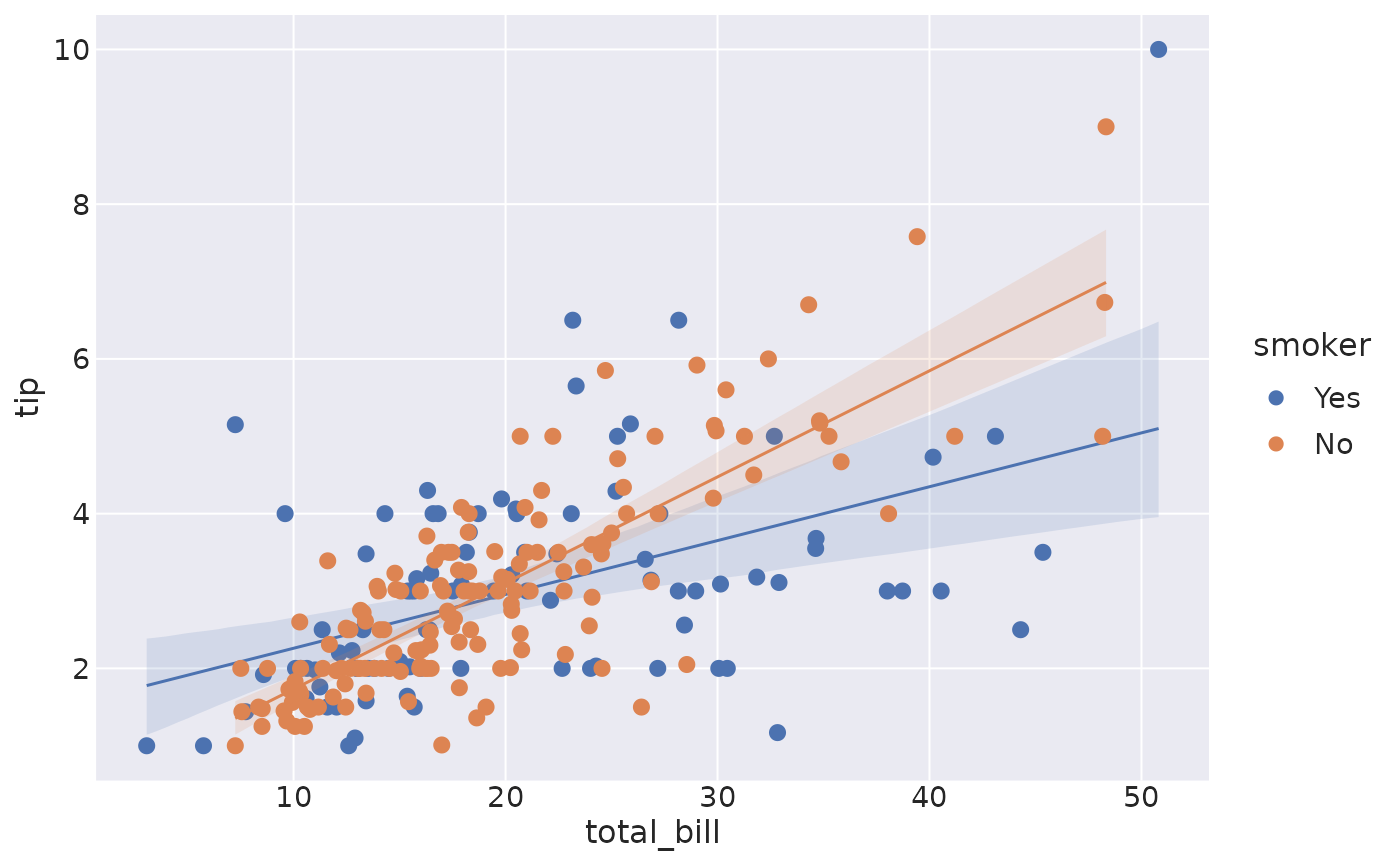
lmplot(data = tips, x = "total_bill", y = "tip", hue = "smoker")
 # Facet across a second variable with col
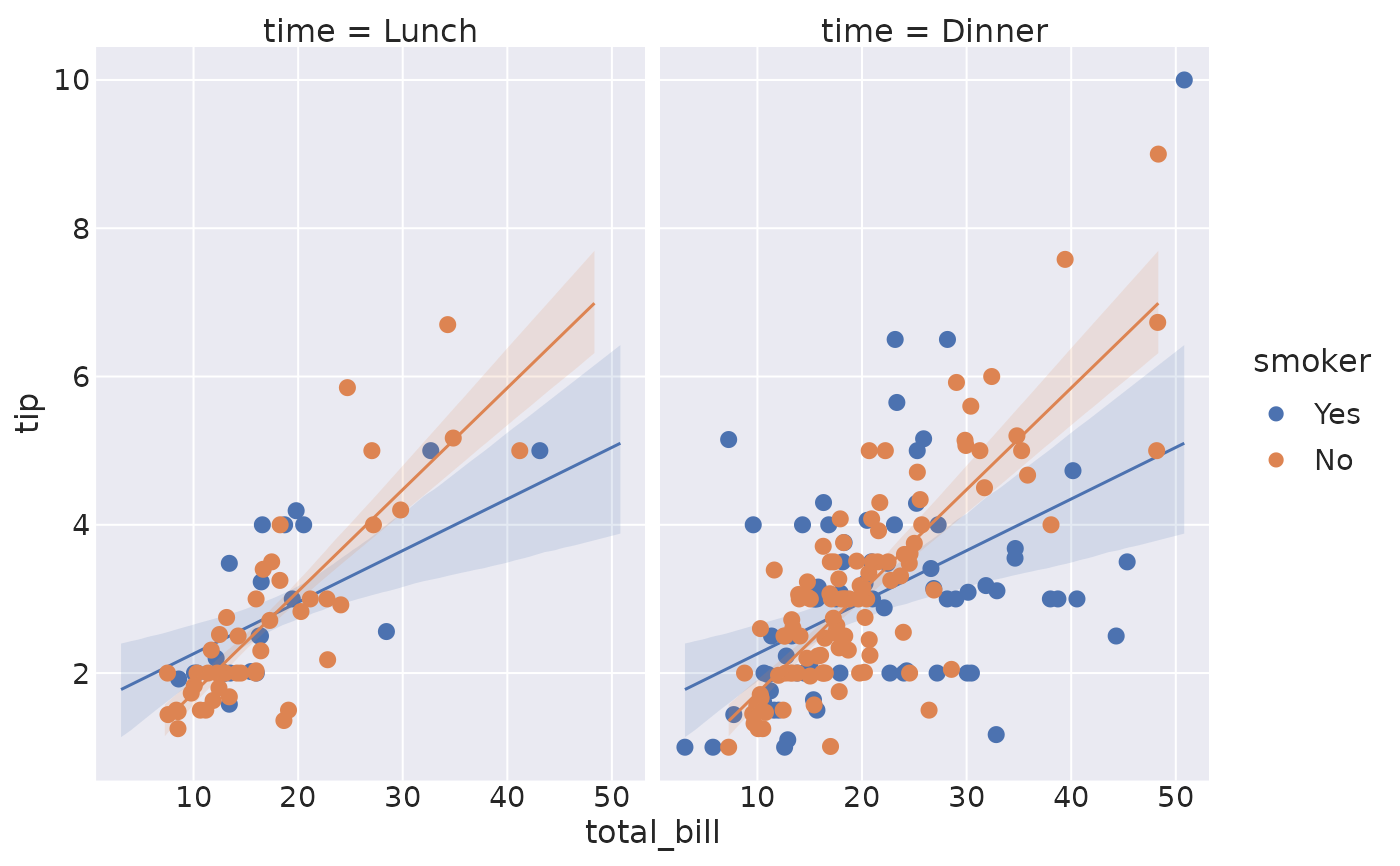
lmplot(data = tips, x = "total_bill", y = "tip", hue = "smoker", col = "time")
# Facet across a second variable with col
lmplot(data = tips, x = "total_bill", y = "tip", hue = "smoker", col = "time")