Port of seaborn.pairplot. Returns a patchwork matrix of scatter plots with
univariate distributions on the diagonal.
Usage
pairplot(
  data,
  vars = NULL,
  hue = NULL,
  kind = "scatter",
  diag_kind = "auto",
  palette = NULL,
  height = 2.5,
  aspect = 1,
  corner = FALSE,
  ...
)Examples
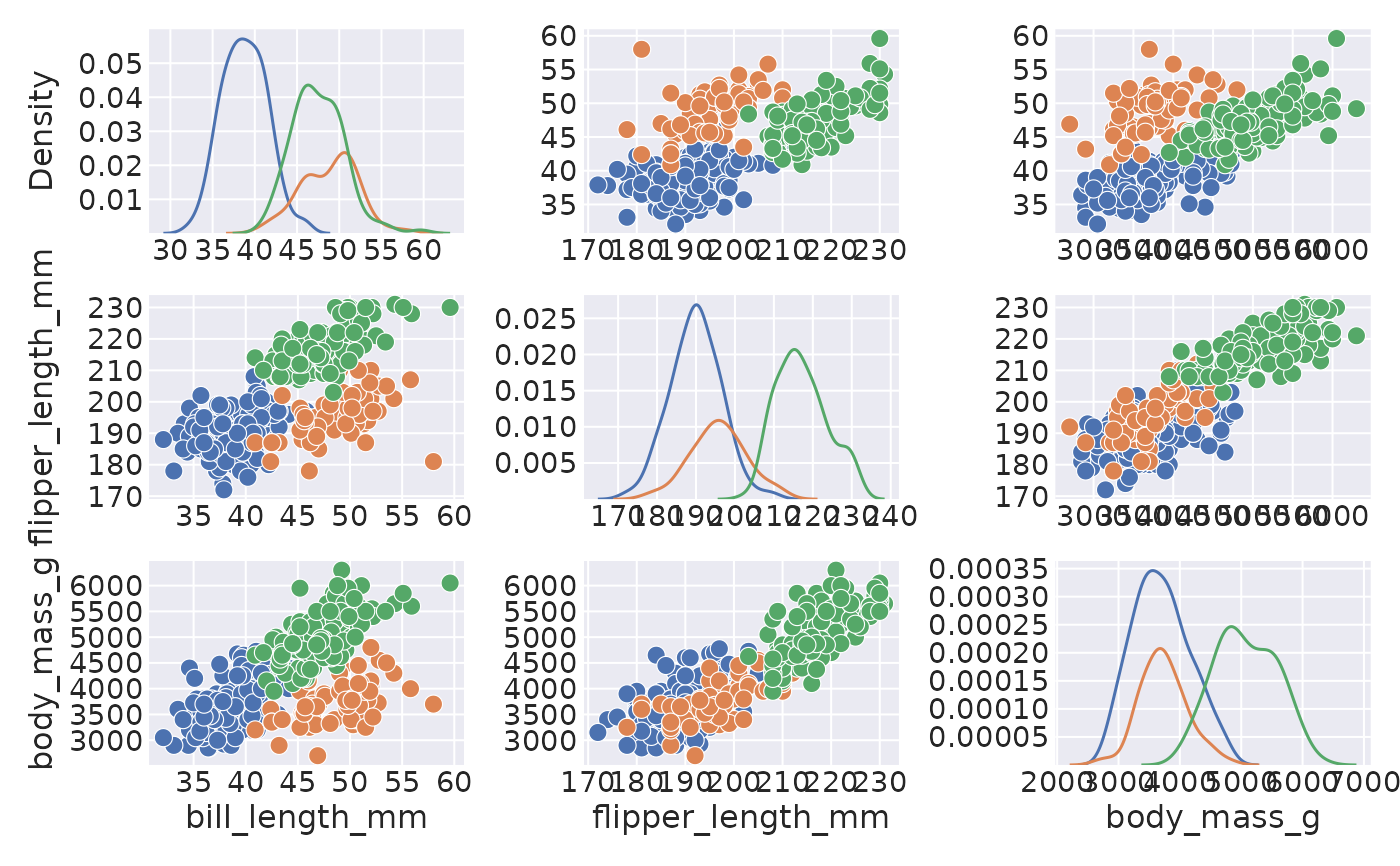
penguins <- load_dataset("penguins")
pairplot(
data = penguins,
vars = c("bill_length_mm", "flipper_length_mm", "body_mass_g"),
hue = "species"
)
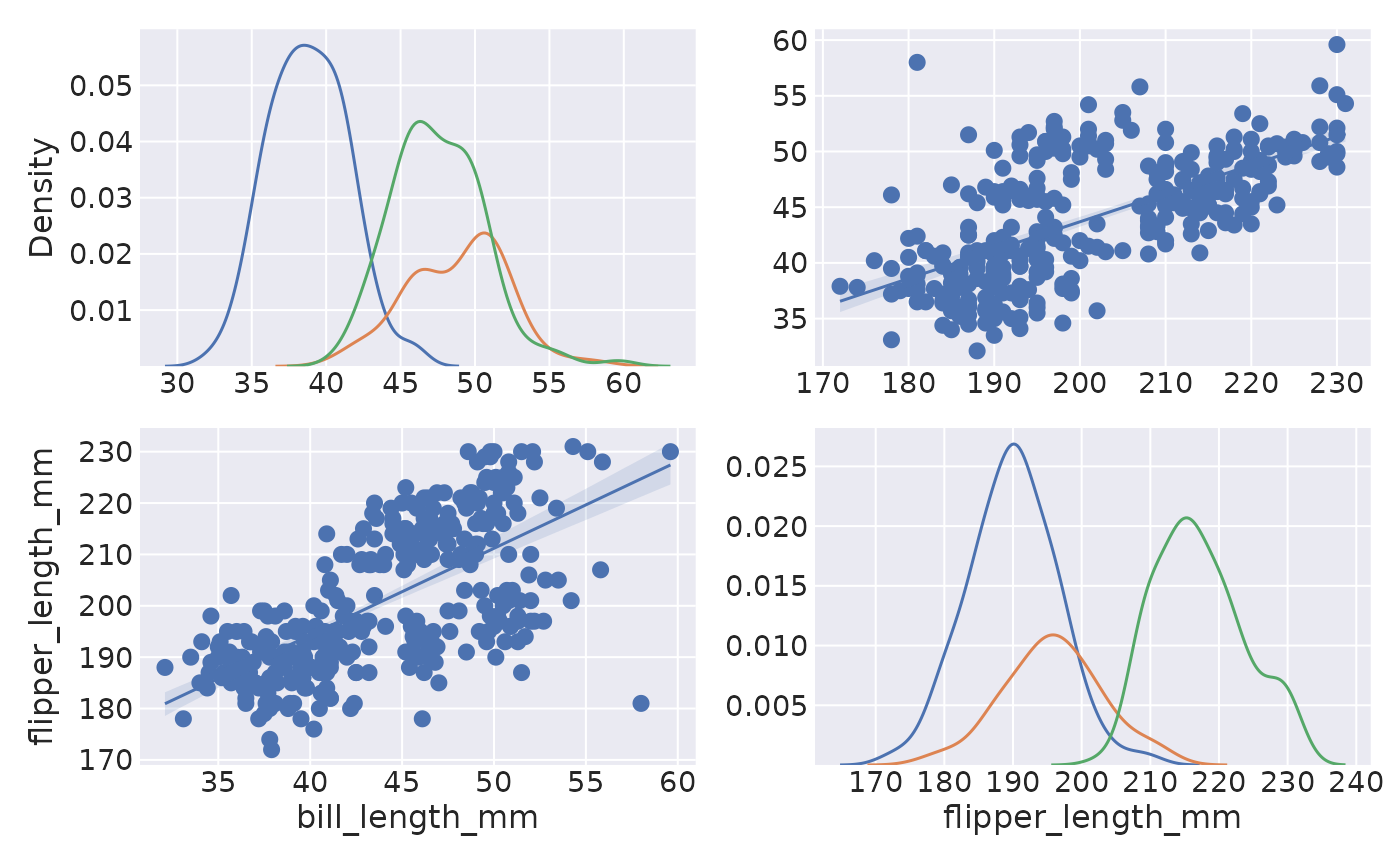
 # Regression fits off the diagonal
pairplot(
data = penguins,
vars = c("bill_length_mm", "flipper_length_mm"),
hue = "species",
kind = "reg"
)
# Regression fits off the diagonal
pairplot(
data = penguins,
vars = c("bill_length_mm", "flipper_length_mm"),
hue = "species",
kind = "reg"
)