Port of seaborn.pointplot. Returns a reaborn_plot.
Usage
pointplot(
  data = NULL,
  x = NULL,
  y = NULL,
  hue = NULL,
  order = NULL,
  hue_order = NULL,
  estimator = "mean",
  errorbar = list("ci", 95),
  n_boot = 1000,
  seed = NULL,
  units = NULL,
  weights = NULL,
  color = NULL,
  palette = NULL,
  markers = "o",
  linestyles = "-",
  dodge = FALSE,
  orient = NULL,
  capsize = 0,
  legend = "auto",
  err_kws = NULL,
  .facet_vars = NULL,
  ...
)
Arguments
- data
A data frame.
- x, y
Variables; the categorical one defines the groups.
- hue
Grouping variable for color (dodged).
- order, hue_order
Level orderings.
- estimator, errorbar, n_boot, seed
Aggregation + error settings.
- units, weights
Bootstrap structure / weights (units reserved).
- color
Single color override.
- palette
Palette for the hue mapping.
- markers, linestyles
Marker and line styling.
- dodge
Dodge points by hue.
- orient
"v","h", orNULLto infer.- capsize
Width of the error bar caps.
- legend
Legend control.
- err_kws
Passed to the error bar geom.
- .facet_vars
Internal; facet columns forwarded by the figure-level dispatchers (catplot/displot/relplot). Not intended for direct use.
- ...
Passed to the bar geom.
Examples
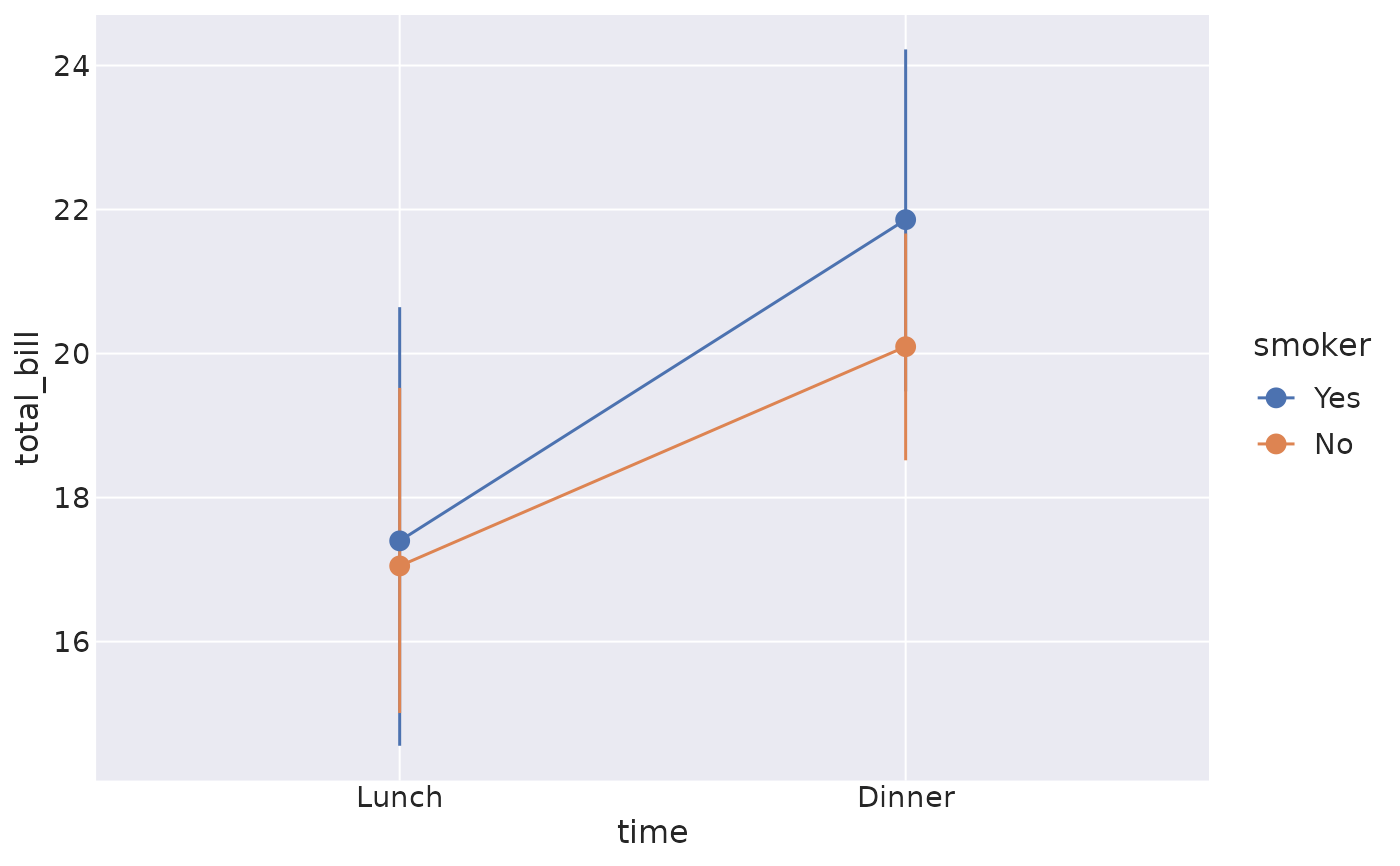
tips <- load_dataset("tips")
pointplot(data = tips, x = "time", y = "total_bill", hue = "smoker")
 # Dodge the hue levels and add caps to the error bars
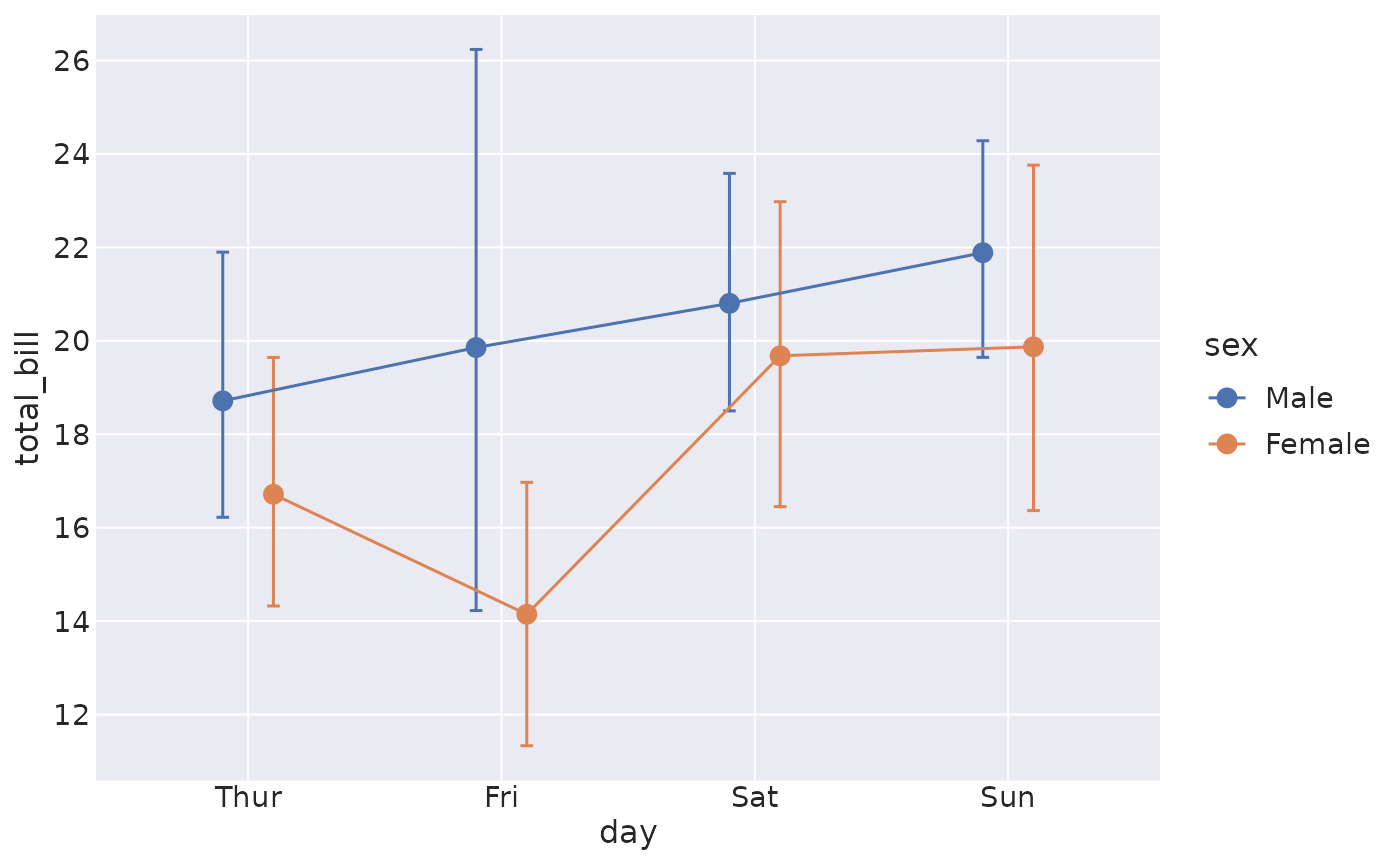
pointplot(
data = tips, x = "day", y = "total_bill", hue = "sex",
dodge = TRUE, capsize = 0.1
)
# Dodge the hue levels and add caps to the error bars
pointplot(
data = tips, x = "day", y = "total_bill", hue = "sex",
dodge = TRUE, capsize = 0.1
)