Port of seaborn.residplot. Returns a reaborn_plot.
Usage
residplot(
  data = NULL,
  x = NULL,
  y = NULL,
  lowess = FALSE,
  order = 1,
  robust = FALSE,
  color = NULL,
  scatter_kws = NULL,
  line_kws = NULL,
  ...
)
Arguments
- data
A data frame.
- x, y
Variables.
- lowess
Add a lowess smooth of the residuals.
- order
Polynomial order for the fit (default 1, linear).
- robust
Fit a robust regression when computing residuals.
- color
Color for points and line (default the first palette color).
- scatter_kws, line_kws
Lists of extra args for the point / line layers.
- ...
Reserved.
Examples
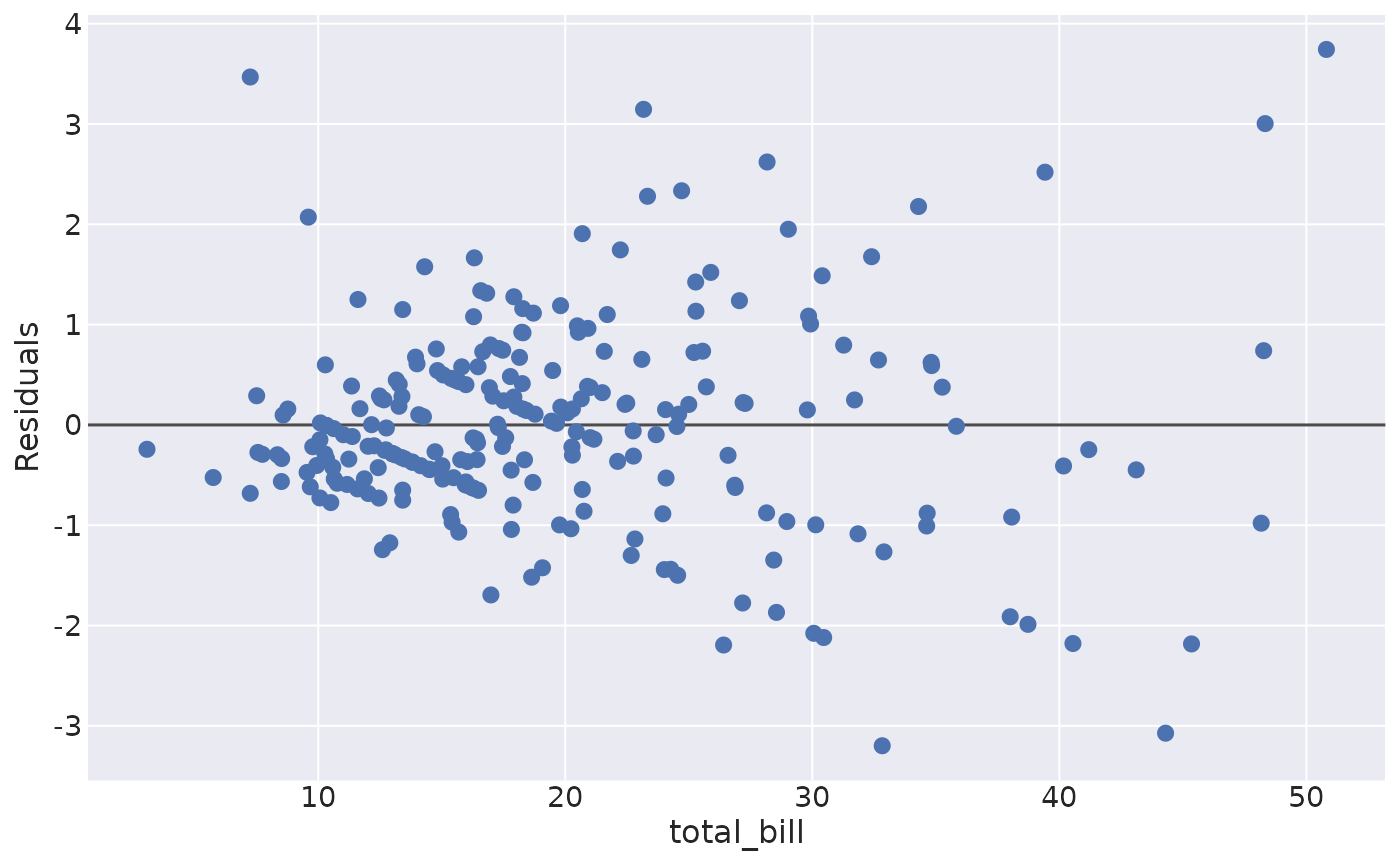
tips <- load_dataset("tips")
residplot(data = tips, x = "total_bill", y = "tip")
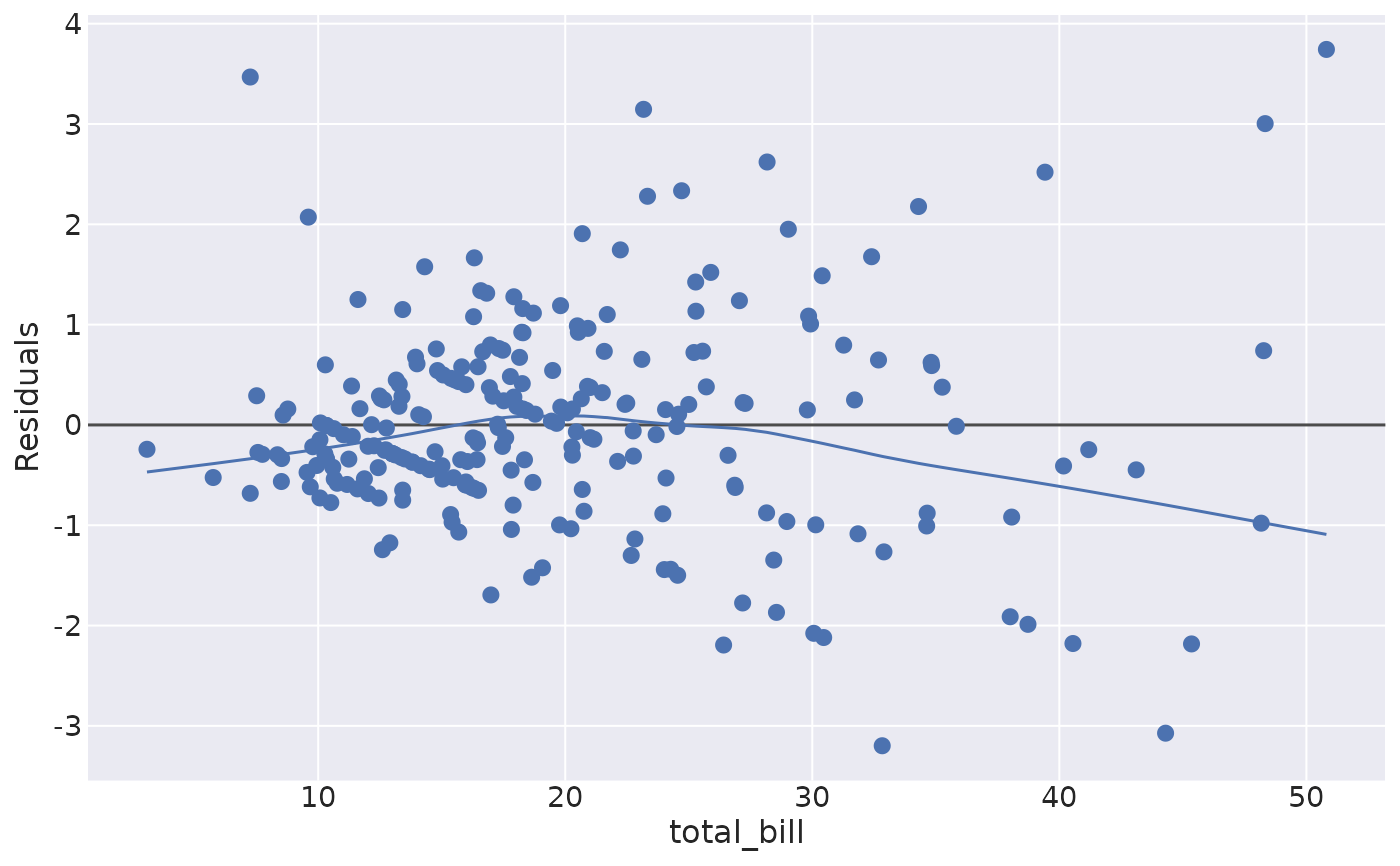
 # Add a lowess smooth to help detect structure in the residuals
residplot(data = tips, x = "total_bill", y = "tip", lowess = TRUE)
# Add a lowess smooth to help detect structure in the residuals
residplot(data = tips, x = "total_bill", y = "tip", lowess = TRUE)