Port of seaborn.rugplot. Draws small ticks at each observation along the
relevant axis. Returns a reaborn_plot (typically added to another plot, but
usable standalone).
Usage
rugplot(
  data = NULL,
  x = NULL,
  y = NULL,
  hue = NULL,
  height = 0.025,
  expand_margins = TRUE,
  palette = NULL,
  hue_order = NULL,
  hue_norm = NULL,
  legend = TRUE,
  ...
)
Arguments
- data
A data frame.
- x, y
Column name/vector for the histogram variable (use
yfor a horizontal histogram).- hue
Grouping variable for color.
- height
Tick height as a fraction of the axis (default
0.025).- expand_margins
Reserved for compatibility.
- palette
Palette for the hue mapping.
- hue_order
Order of hue levels.
- hue_norm
Normalization for a numeric hue.
- legend
Show the legend.
- ...
Passed to the bar geom.
Examples
penguins <- load_dataset("penguins")
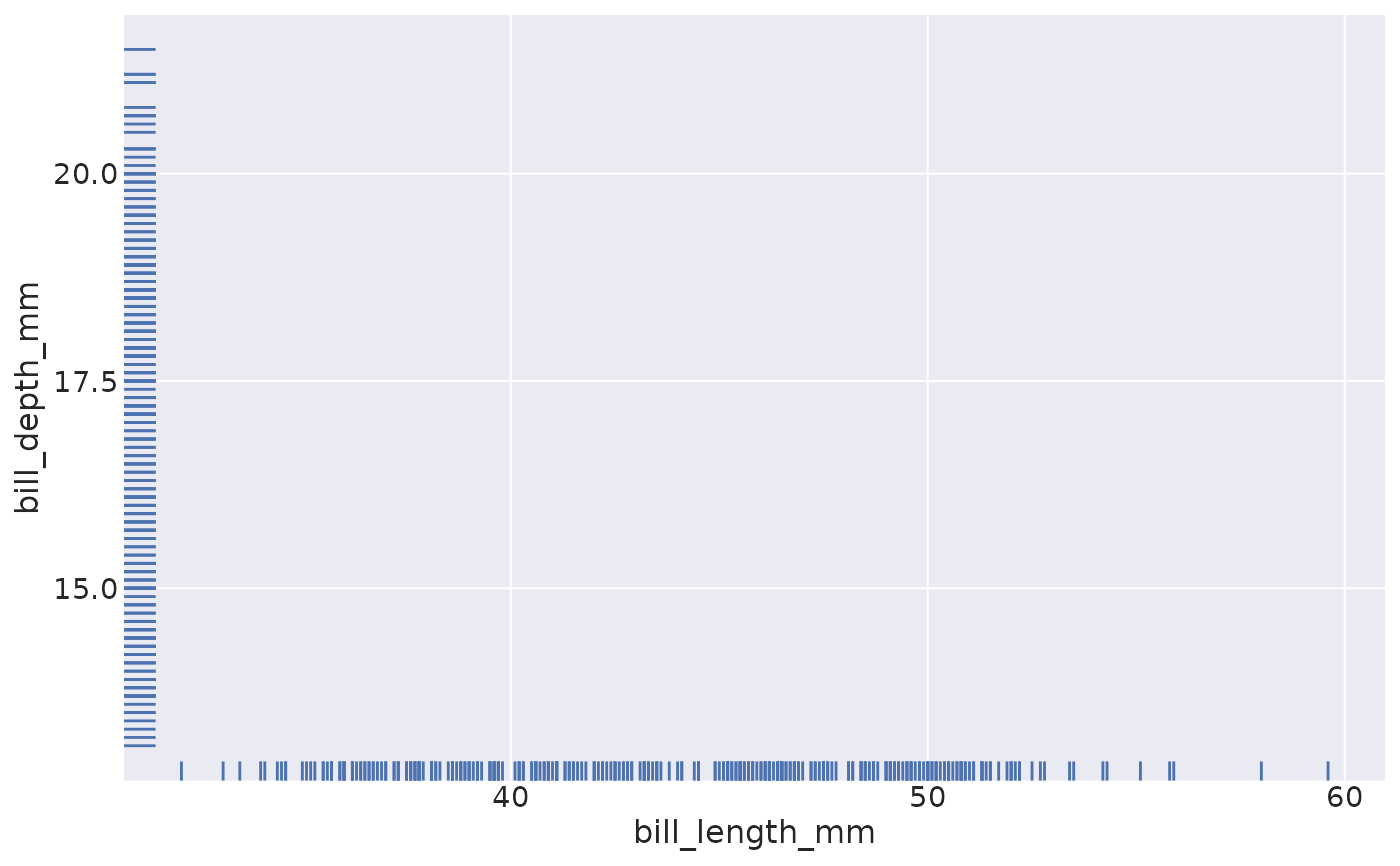
rugplot(data = penguins, x = "bill_length_mm", y = "bill_depth_mm")
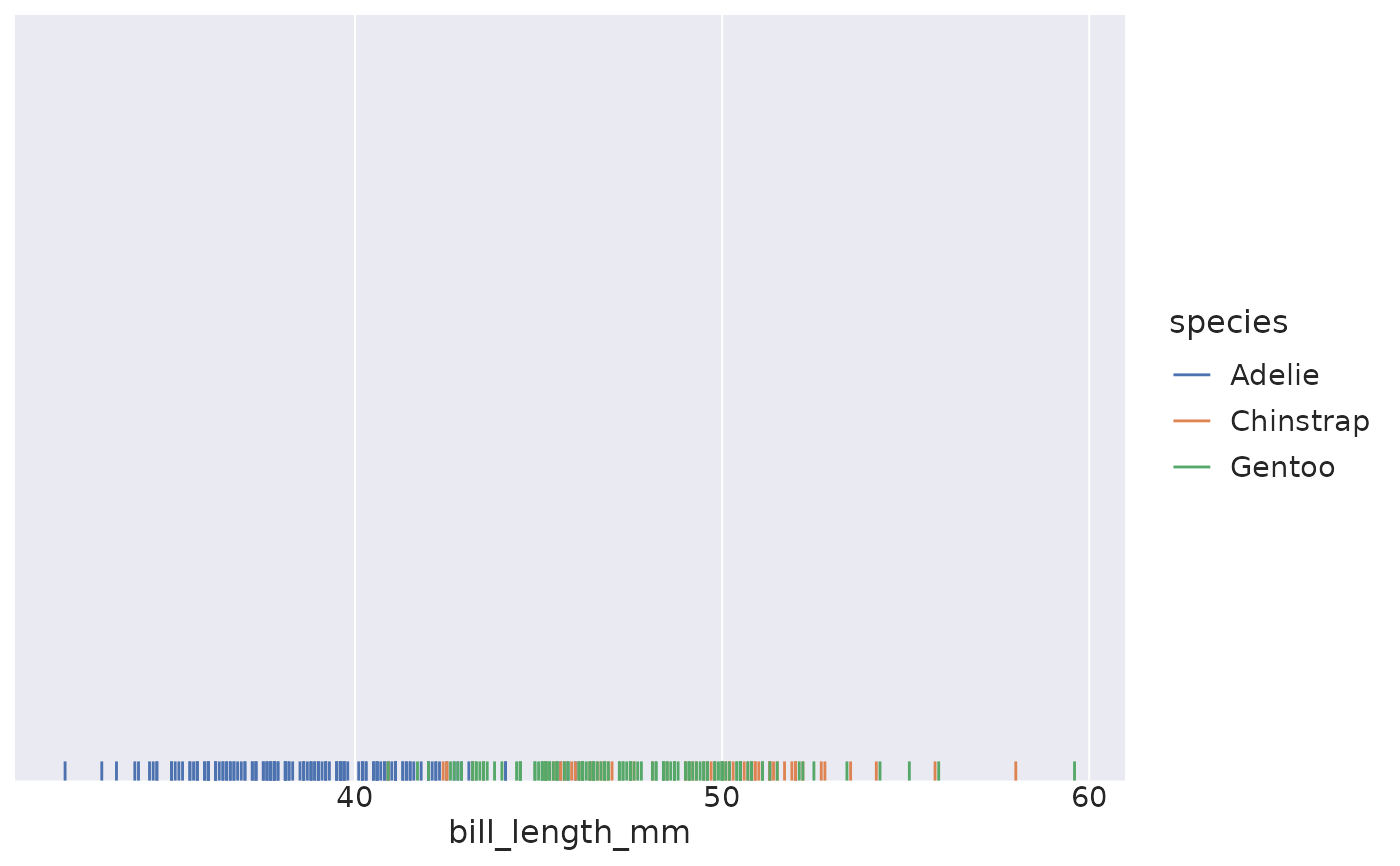
 # Add a hue semantic to color ticks by group
rugplot(data = penguins, x = "bill_length_mm", hue = "species")
# Add a hue semantic to color ticks by group
rugplot(data = penguins, x = "bill_length_mm", hue = "species")