Port of seaborn.scatterplot. Returns a reaborn_plot (a ggplot), so it can
be extended with any ggplot2 component.
Usage
scatterplot(
  data = NULL,
  x = NULL,
  y = NULL,
  hue = NULL,
  size = NULL,
  style = NULL,
  palette = NULL,
  hue_order = NULL,
  hue_norm = NULL,
  sizes = NULL,
  size_order = NULL,
  size_norm = NULL,
  markers = TRUE,
  style_order = NULL,
  legend = "auto",
  ...
)
Arguments
- data
A data frame.
- x, y
Column names (strings) or vectors giving the axes.
- hue, size, style
Column names/vectors for color, size, and marker-style semantics.
- palette, hue_order, hue_norm
Control the color mapping.
- sizes, size_order, size_norm
Control the size mapping.
- markers, style_order
Control the style (marker) mapping.
- legend
"auto","brief","full", orFALSE.- ...
Passed to ggplot2::geom_point.
Examples
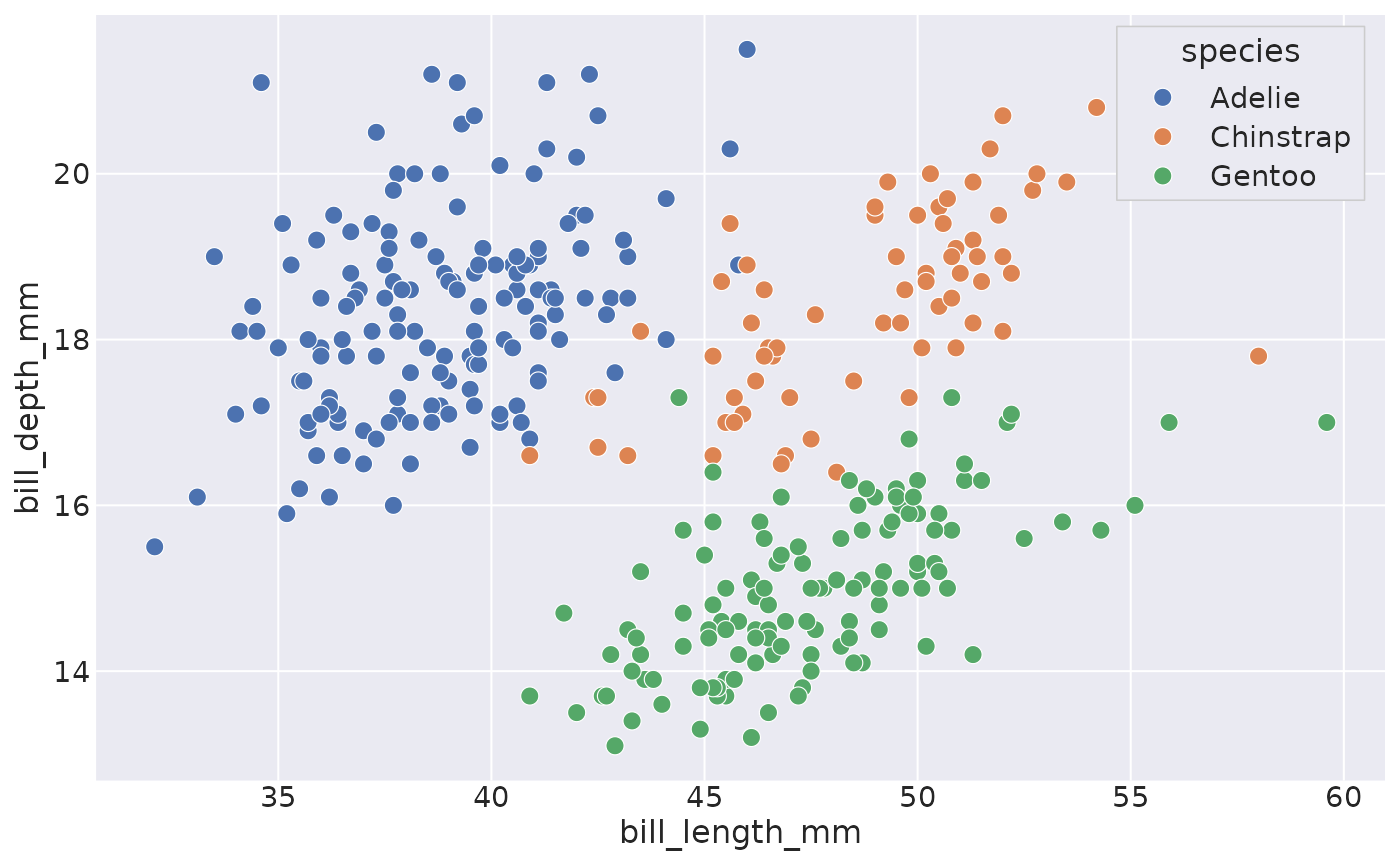
penguins <- load_dataset("penguins")
scatterplot(data = penguins, x = "bill_length_mm", y = "bill_depth_mm", hue = "species")
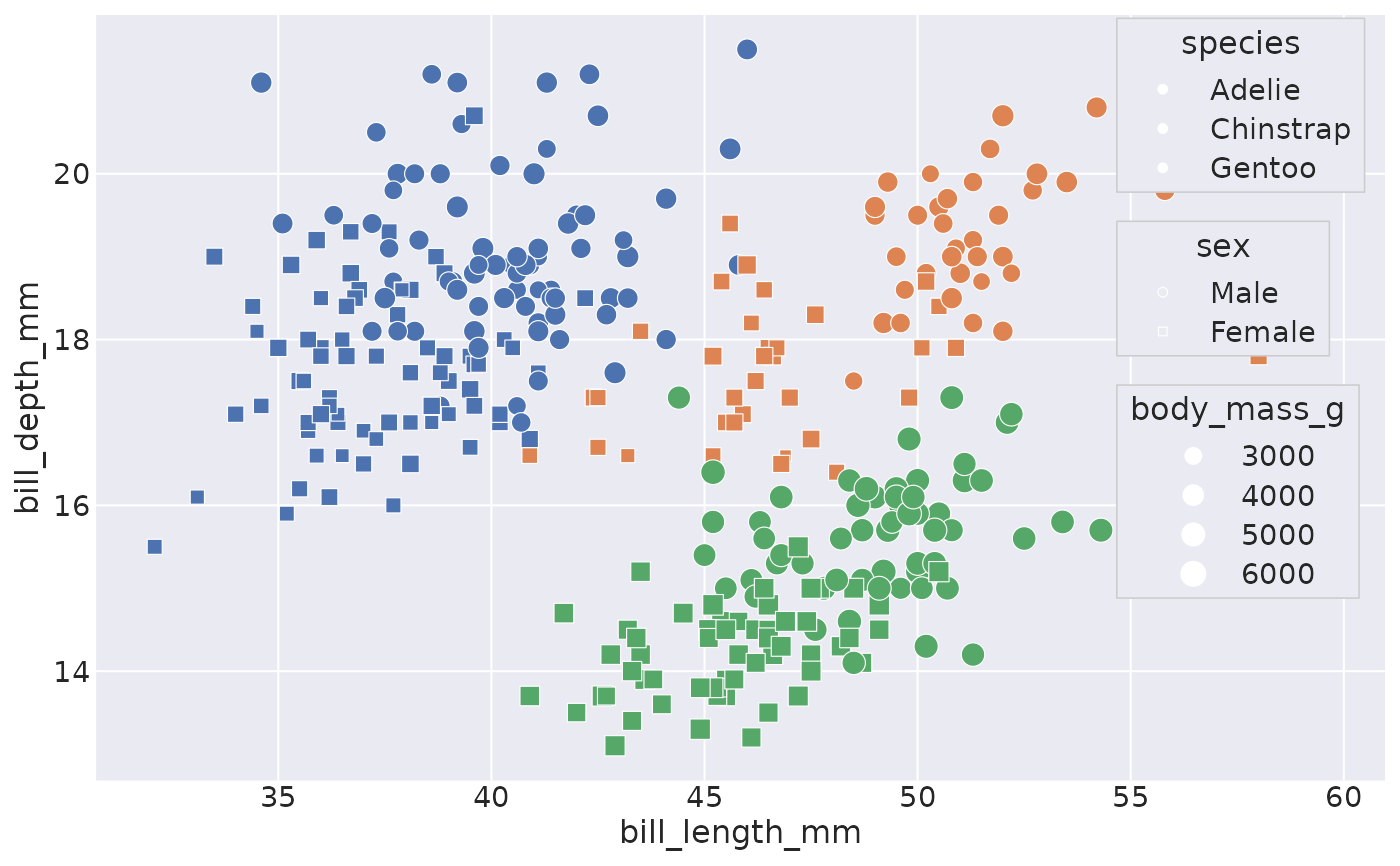
 # Add size and style semantics
scatterplot(
data = penguins,
x = "bill_length_mm",
y = "bill_depth_mm",
hue = "species",
size = "body_mass_g",
style = "sex"
)
# Add size and style semantics
scatterplot(
data = penguins,
x = "bill_length_mm",
y = "bill_depth_mm",
hue = "species",
size = "body_mass_g",
style = "sex"
)