Port of seaborn.violinplot. The kernel density matches
scipy.stats.gaussian_kde. Returns a reaborn_plot.
Usage
violinplot(
  data = NULL,
  x = NULL,
  y = NULL,
  hue = NULL,
  order = NULL,
  hue_order = NULL,
  orient = NULL,
  color = NULL,
  palette = NULL,
  saturation = 0.75,
  fill = TRUE,
  inner = "box",
  split = FALSE,
  width = 0.8,
  dodge = "auto",
  gap = 0,
  linewidth = NULL,
  linecolor = "auto",
  cut = 2,
  gridsize = 100,
  bw_method = "scott",
  bw_adjust = 1,
  density_norm = "area",
  common_norm = FALSE,
  legend = "auto",
  inner_kws = NULL,
  .facet_vars = NULL,
  ...
)
Arguments
- data
A data frame.
- x, y
Variables; the categorical one defines the groups.
- hue
Grouping variable for color (dodged).
- order, hue_order
Level orderings.
- orient
"v","h", orNULLto infer.- color, palette, saturation, fill
Color controls (saturation default 0.75).
- inner
"box","quart","stick","point", orNULL.- split
Draw split violins for two hue levels.
- width, gap
Box width and gap between dodged boxes.
- dodge
How to dodge violins by hue (
"auto",TRUE, orFALSE).- linewidth
Outline width.
- linecolor
Outline color (
"auto"for seaborn's gray).- cut, gridsize, bw_method, bw_adjust
KDE controls.
- density_norm
"area","count", or"width".- common_norm
Normalize densities across all groups together.
- legend
Legend control.
- inner_kws
Passed to the inner annotation geoms.
- .facet_vars
Internal; facet columns forwarded by the figure-level dispatchers (catplot/displot/relplot). Not intended for direct use.
- ...
Passed to ggplot2::geom_boxplot.
Examples
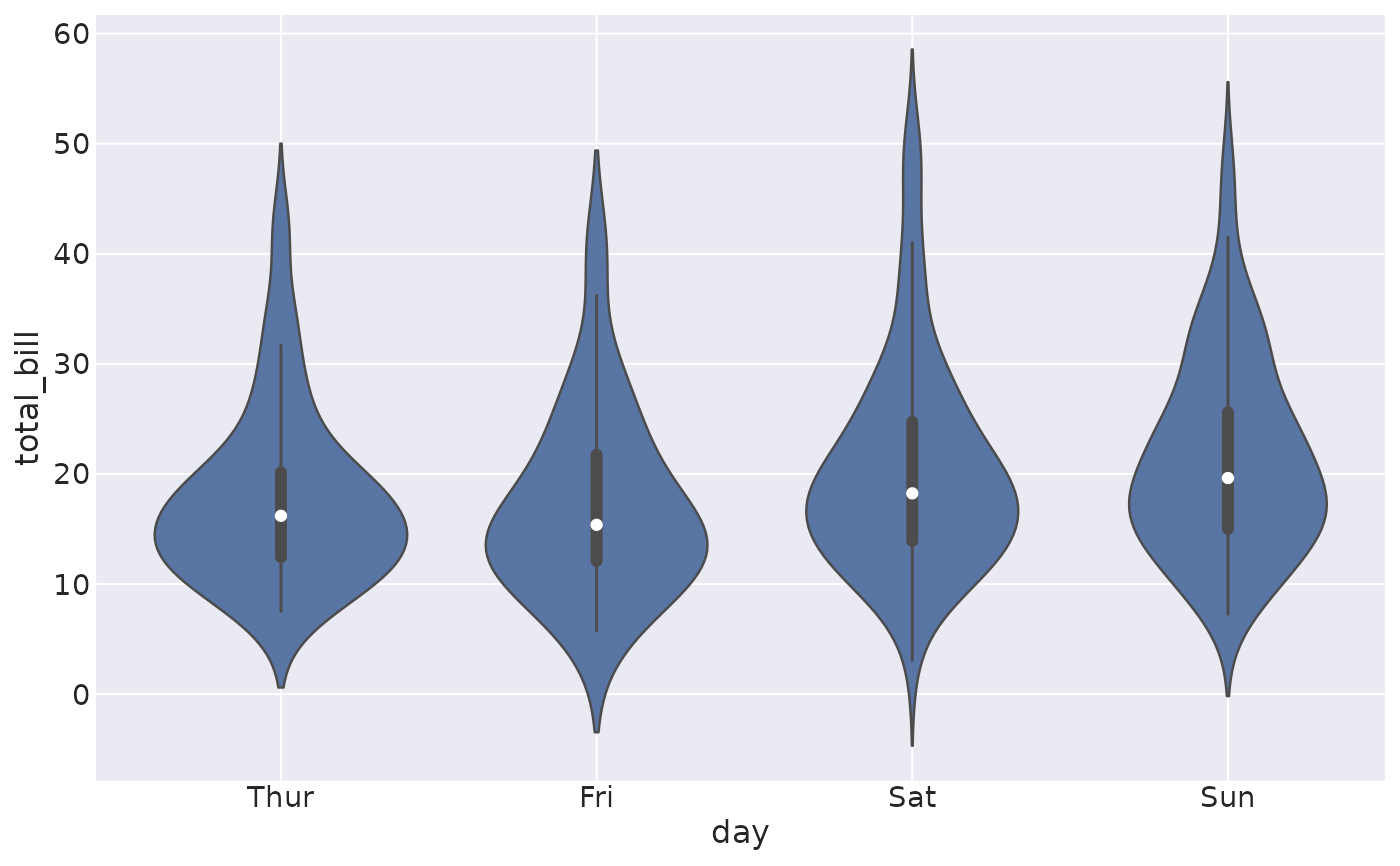
tips <- load_dataset("tips")
violinplot(data = tips, x = "day", y = "total_bill")
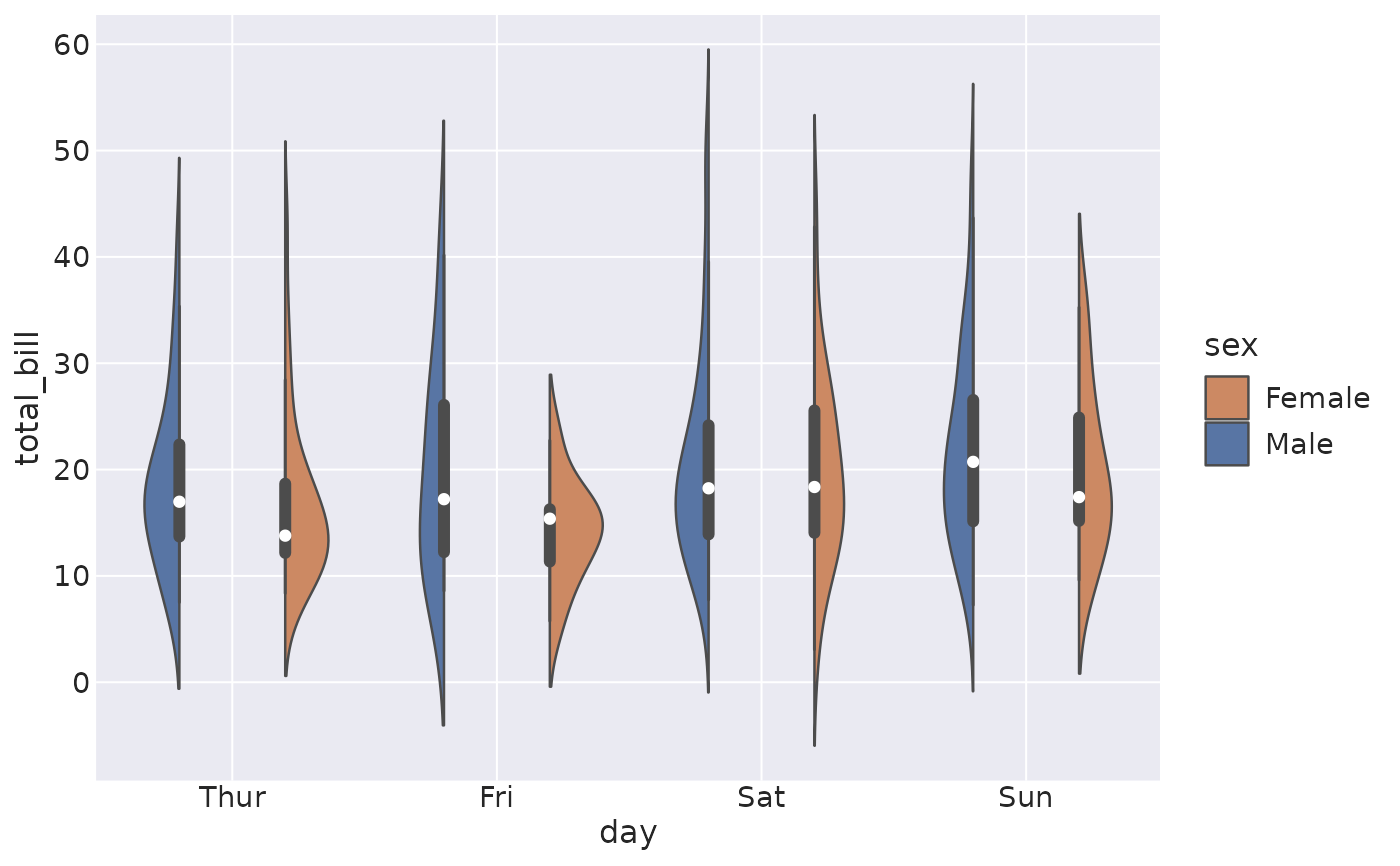
 violinplot(data = tips, x = "day", y = "total_bill", hue = "sex", split = TRUE)