Port of seaborn.relplot. Draws scatterplot (kind = "scatter") or
lineplot (kind = "line") onto a grid of facets defined by row/col.
Returns a reaborn_plot (a faceted ggplot) with the legend outside, like a
seaborn FacetGrid.
Usage
relplot(
  data = NULL,
  x = NULL,
  y = NULL,
  hue = NULL,
  size = NULL,
  style = NULL,
  units = NULL,
  weights = NULL,
  row = NULL,
  col = NULL,
  col_wrap = NULL,
  row_order = NULL,
  col_order = NULL,
  palette = NULL,
  hue_order = NULL,
  hue_norm = NULL,
  sizes = NULL,
  size_order = NULL,
  size_norm = NULL,
  markers = NULL,
  dashes = NULL,
  style_order = NULL,
  legend = "auto",
  kind = "scatter",
  height = 5,
  aspect = 1,
  facet_kws = NULL,
  ...
)
Arguments
- data
A data frame.
- x, y
Column names (strings) or vectors giving the axes.
- hue, size, style
Column names/vectors for color, size, and marker-style semantics.
- units, weights
Column names/vectors for the unit grouping and weights.
- row, col
Column names to facet by.
- col_wrap
Wrap the column facets at this width.
- row_order, col_order
Facet orderings.
- palette, hue_order, hue_norm
Control the color mapping.
- sizes, size_order, size_norm
Control the size mapping.
- dashes, markers
Style mapping controls.
- style_order
Order of style levels.
- legend
"auto","brief","full", orFALSE.- kind
"scatter"or"line".- height, aspect
Facet height (inches) and aspect ratio (stored as attributes used as defaults when saving).
- facet_kws
Reserved for compatibility.
- ...
Passed to ggplot2::geom_line.
Examples
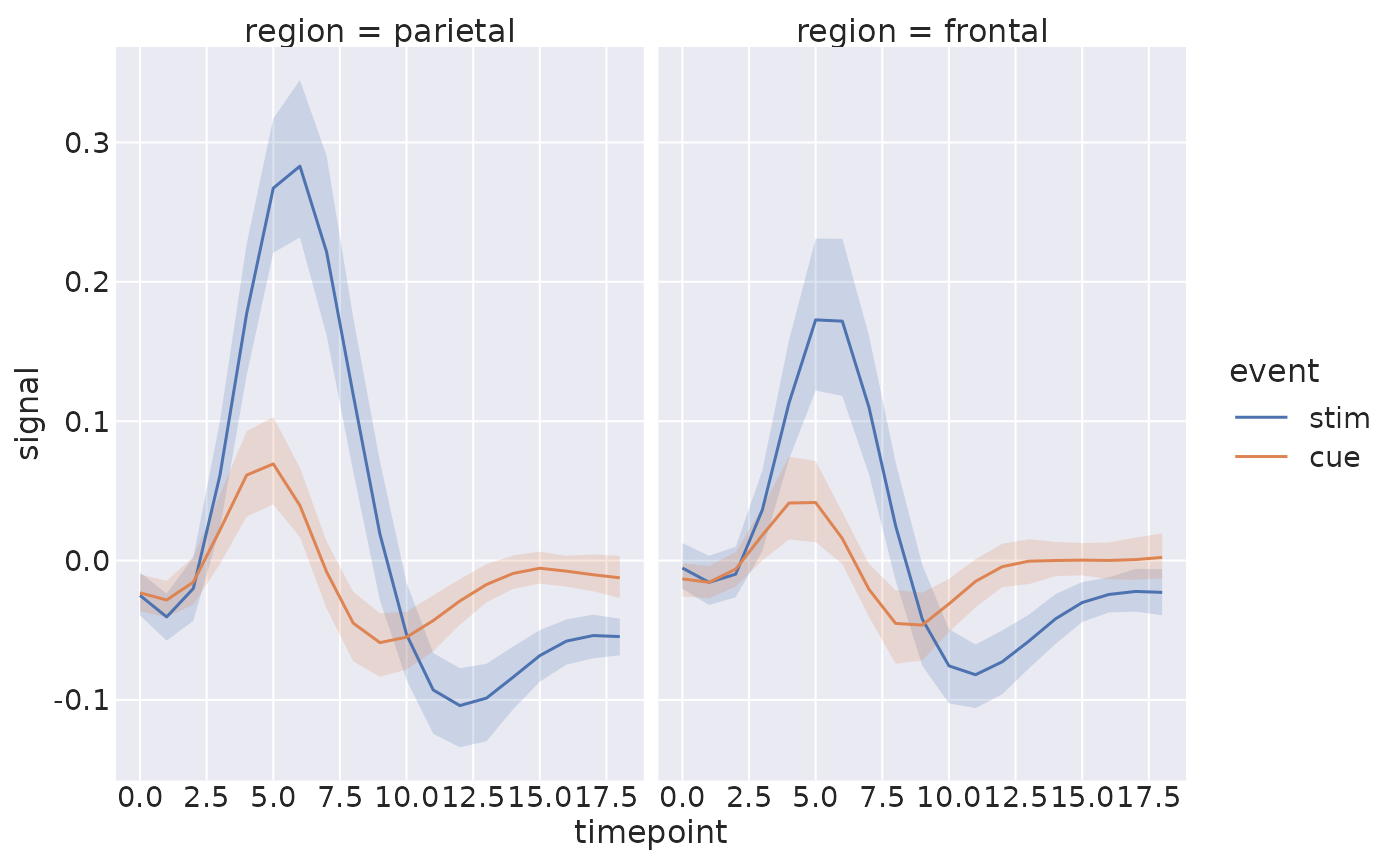
fmri <- load_dataset("fmri")
relplot(
data = fmri, x = "timepoint", y = "signal",
hue = "event", col = "region", kind = "line"
)
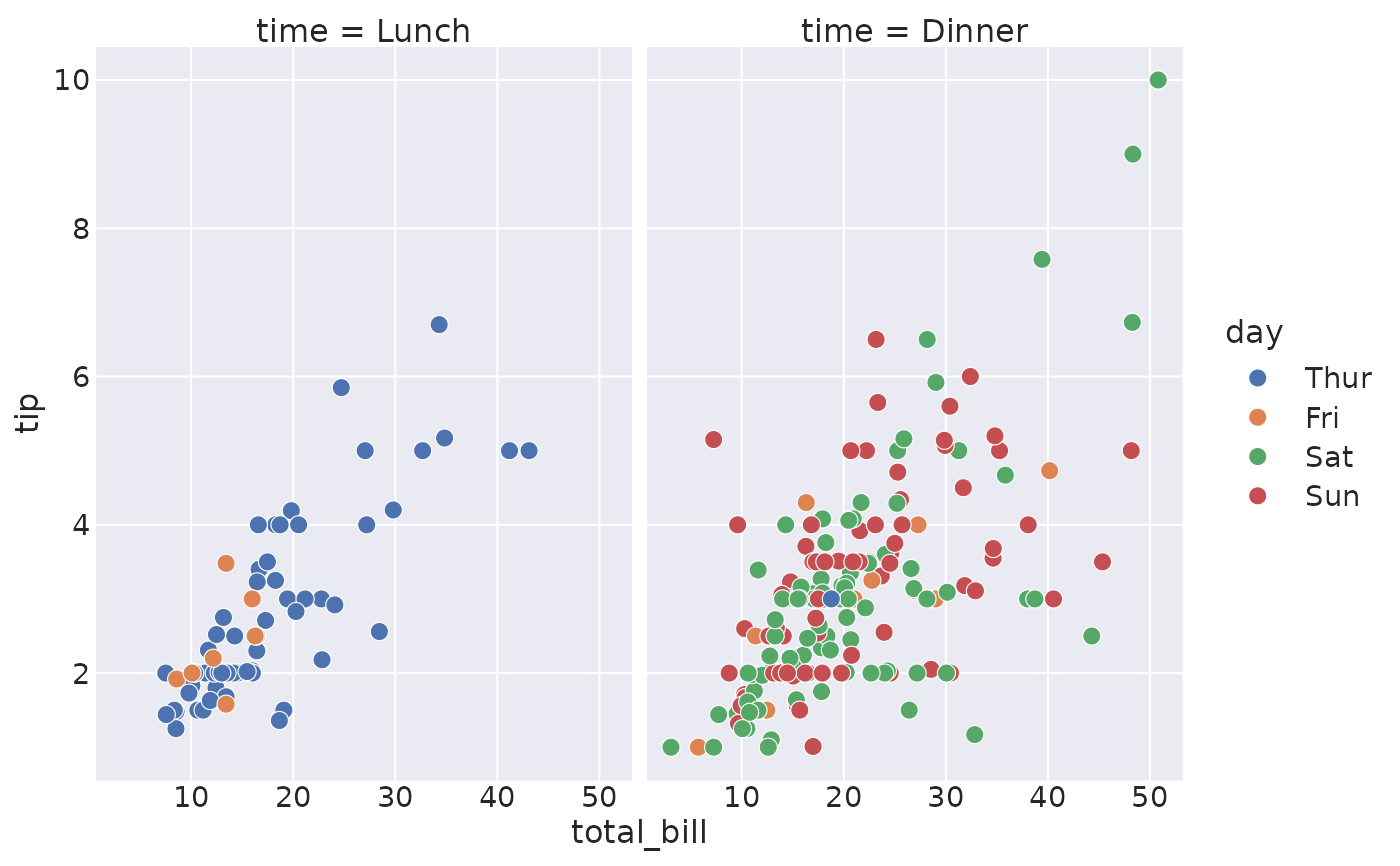
 tips <- load_dataset("tips")
relplot(data = tips, x = "total_bill", y = "tip", hue = "day", col = "time")
tips <- load_dataset("tips")
relplot(data = tips, x = "total_bill", y = "tip", hue = "day", col = "time")